How to read Heat maps, Transparency maps, and Gaze plots?
This article explains what Heat maps, Transparency maps, and Gaze plots are and how it helps in analyzing Eye-Tracking insights.
Heat maps, Transparency maps, and Gaze plots are plotted using the customer's Eye Gaze points on top of the stimulus (image/video/planograms/UX journeys).
What is an Eye Tracking Heat Map?
Eye Tracking Heat maps use varying colour intensity to highlight areas that were viewed most by the respondents.
Eye gaze points are plotted second by second on the stimulus and are aggregated for all the participants. This aggregated sum of gaze points is used to define colour intensities. With the increase in the number of gaze points, the colour changes in the VIBGYOR gradient.
The size or pixel identified on the stimulus for each individual gaze point per second is based on the screen size of the respondent's device and is determined using the Eye-Tracking calibration.
Users can adjust the Radius, Shadow, and Blur of the eye gaze points using the options given at the top of the map.
Radius - The size of the heatmap for each eye-gaze point on the stimuli. A higher radius will result in larger heatmaps.
Shadow - The shape or areas produced by the size of the heatmap for each eye-gaze point i.e. radius of the stimuli. A higher shadow will result in a larger effect on the heat maps.
Blur - The blur factor that will be applied to all data points. The higher the blur factor is, the smoother the gradients will be.
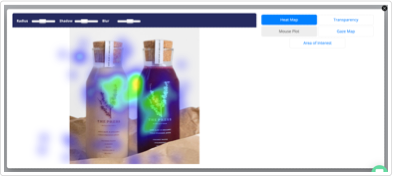
What is a Transparency map?
Just like Heat maps, Transparency maps are also plotted using the participant's Gaze Points on top of the Stimulus. But instead of using varying color intensities, the Stimulus is made transparent where the gaze points aggregate. A higher concentration of points results in clear visibility compared to segments with fewer points. Segments with no Eye Gaze points are hidden.
Based on the point of gaze, the transparency map shows only the sections which were viewed. The more a section was viewed, the clearest it is on the map. Sections that did not get viewed are blocked, as shown below.
Transparency maps help to view the various segments of the stimuli as seen by the participant.
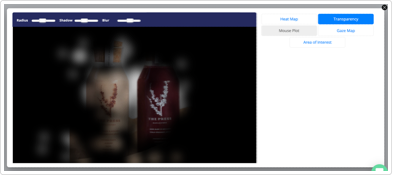
Users can adjust the Radius, Shadow, and Blur of the map using the options given at the top of the map.
What is a Gaze Plot map?
Gazeplot is a visual representation of the journey your eyes take while watching a stimulus (Image, Video, Planogram, etc). Gaze plots have numbered dots in a sequential manner that plot the travel of your eyes telling you exactly where you were looking at what point of time and the journey your eyes took. These numbered dots are called fixation points.
Gaze maps are available at both the Individual user-level and aggregate level.
Below are a few controls that can be used to change the visualization of the gaze map.
Control Dispersion/Fixation
Min (Points)
Definition
This is a pixel value. The pixel area that needs to be considered as one area, under which all the views will be considered as a fixation point. The user needs to look at this area for at least one second to be considered as one fixation point. Higher fixation points within a dispersion lead to bigger dots on the gaze map.
Minimum Number of views needed in the dispersion
Max (Points)
Min (s)
Max (s)
area to be considered as a fixation point. If minimum views are not achieved in the dispersion area, the fixation point will not be plotted on the gaze map
The maximum number of views within a dispersion area that can be merged into a fixation point. If the views exceed this max value, a new fixation point will be generated within the same area on the gaze map.
The min duration of the video from where you need to start seeing the gaze map
The max duration of the video till where you want to see the gaze map

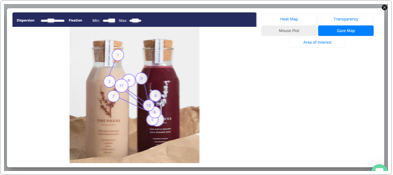
Users can change the Dispersion and Fixation of the Gaze Plots using the sliders at the top.
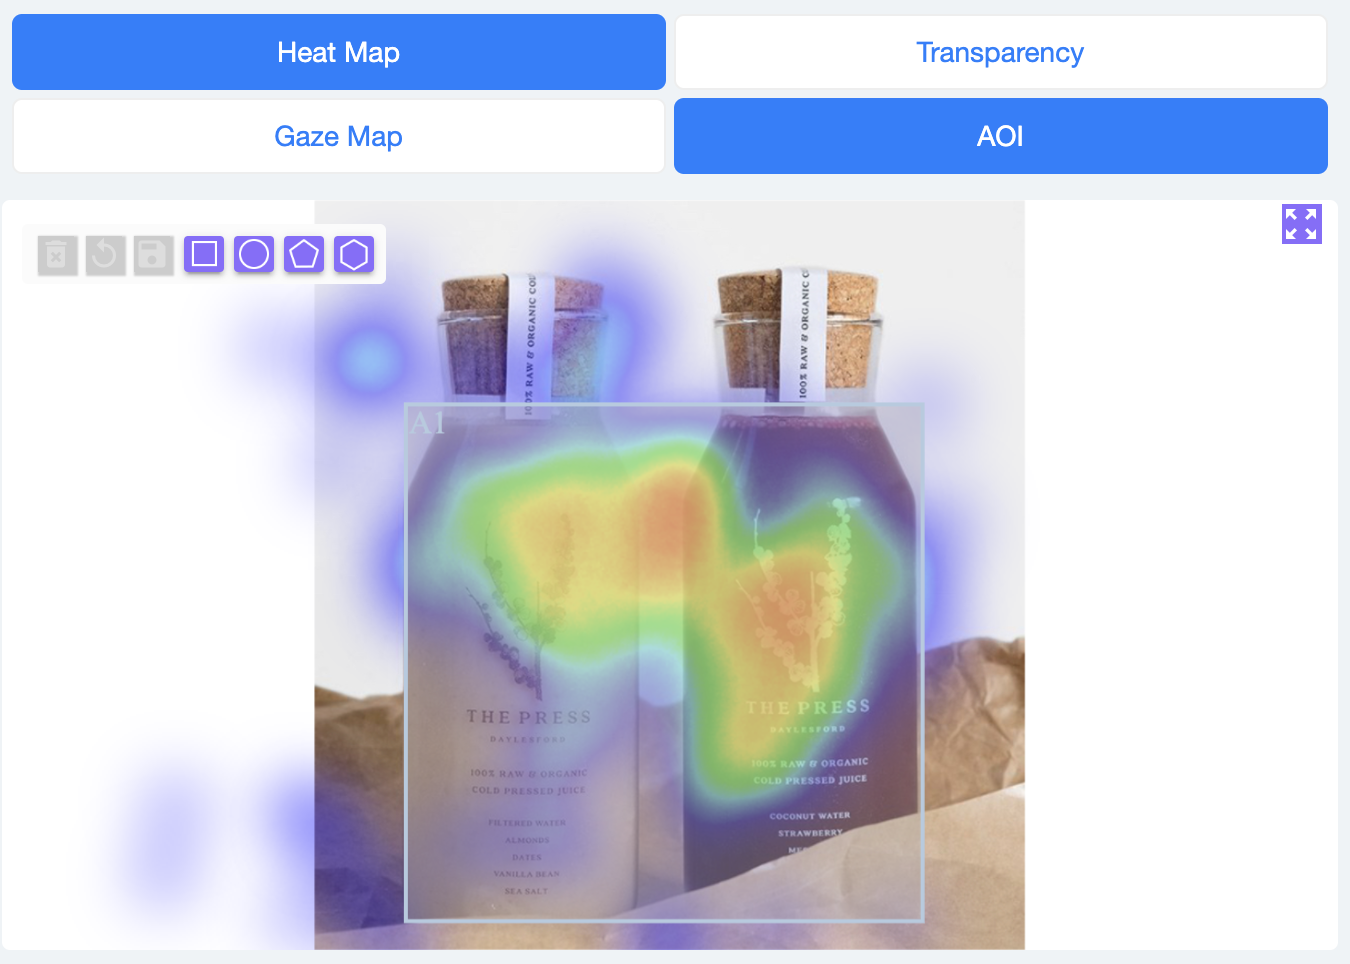
How to add Area of Interest to the maps?
Affect Lab allows users to mark required sections of the stimuli as Area of Interest (AOI) to view the results in the selected sections. This allows for a deeper analysis of the results. Users can select the Area of Interest option,
https://support.affectlab.io/article/215-how-to-read-heat-maps-transparency-maps-and-gaze-plots Page 4 of 6
How to read Heat maps, Transparency maps, and Gaze plots? - Affect Lab Knowledge Base 14/06/23, 4:54 PM
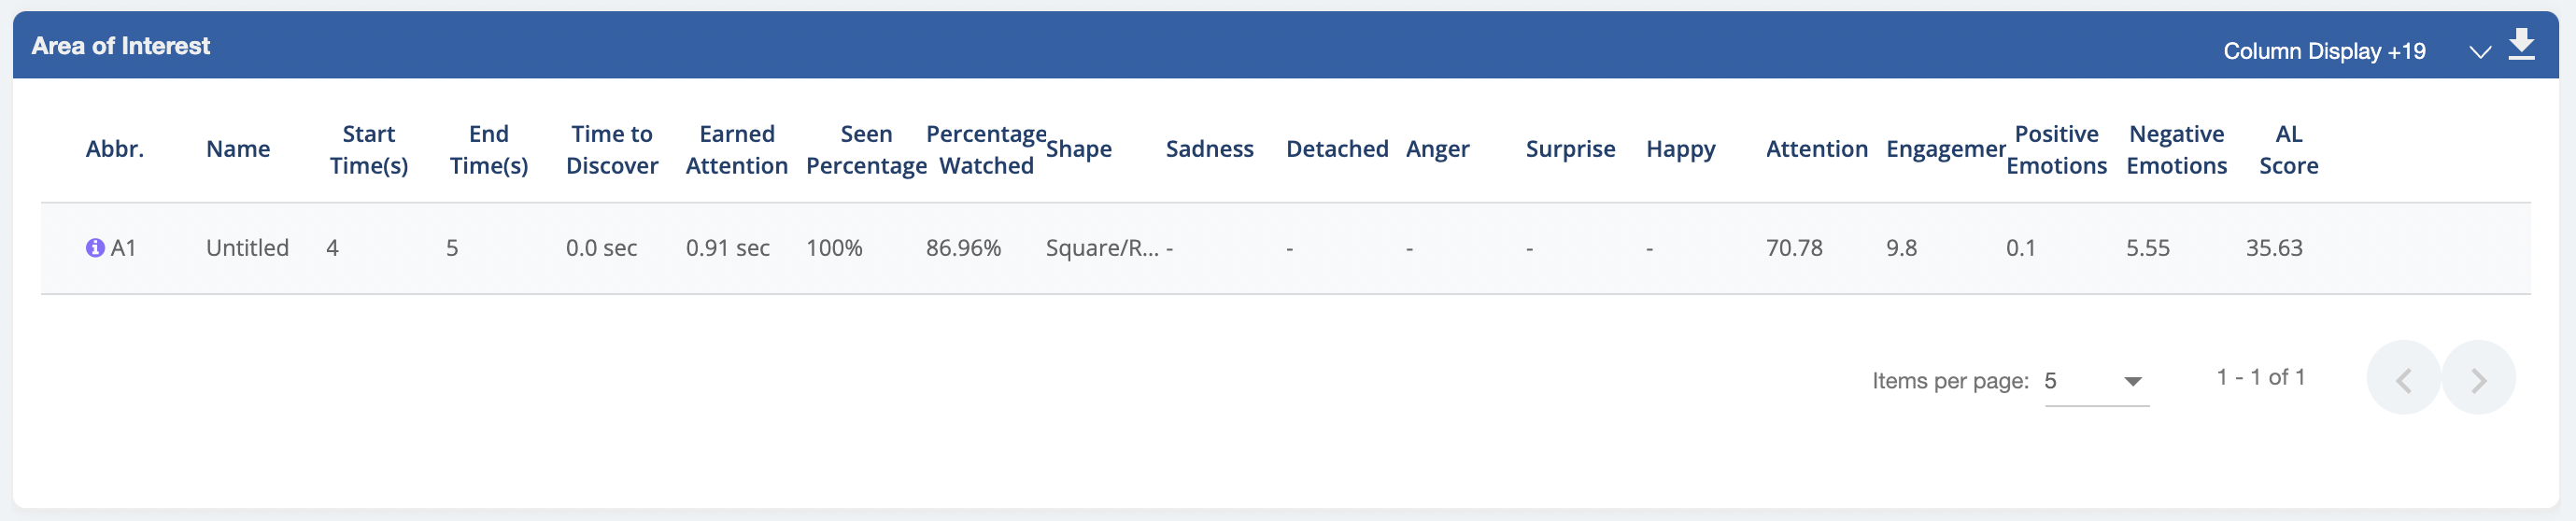
select a shape (Circle, Square, Pentagon, Hexagon), and add it on top of the stimuli. Eye Tracking results for the selected AOI can be obtained in a table next to the stimuli.
The AOI results are provided in the table below, which can be downloaded as a CSV file.