Tester Info Dashboard in Insights Beta
In the Tester Info Dashboard, you will find all the charts related to respondents' information, which they filled in while taking the survey, the status of the stage where the respondents are, dropping questions and much more!
All the charts present in this dashboard are very self-explanatory and can be downloaded as an image in .png format.
The following charts are present in the dashboard:
1. Demographics
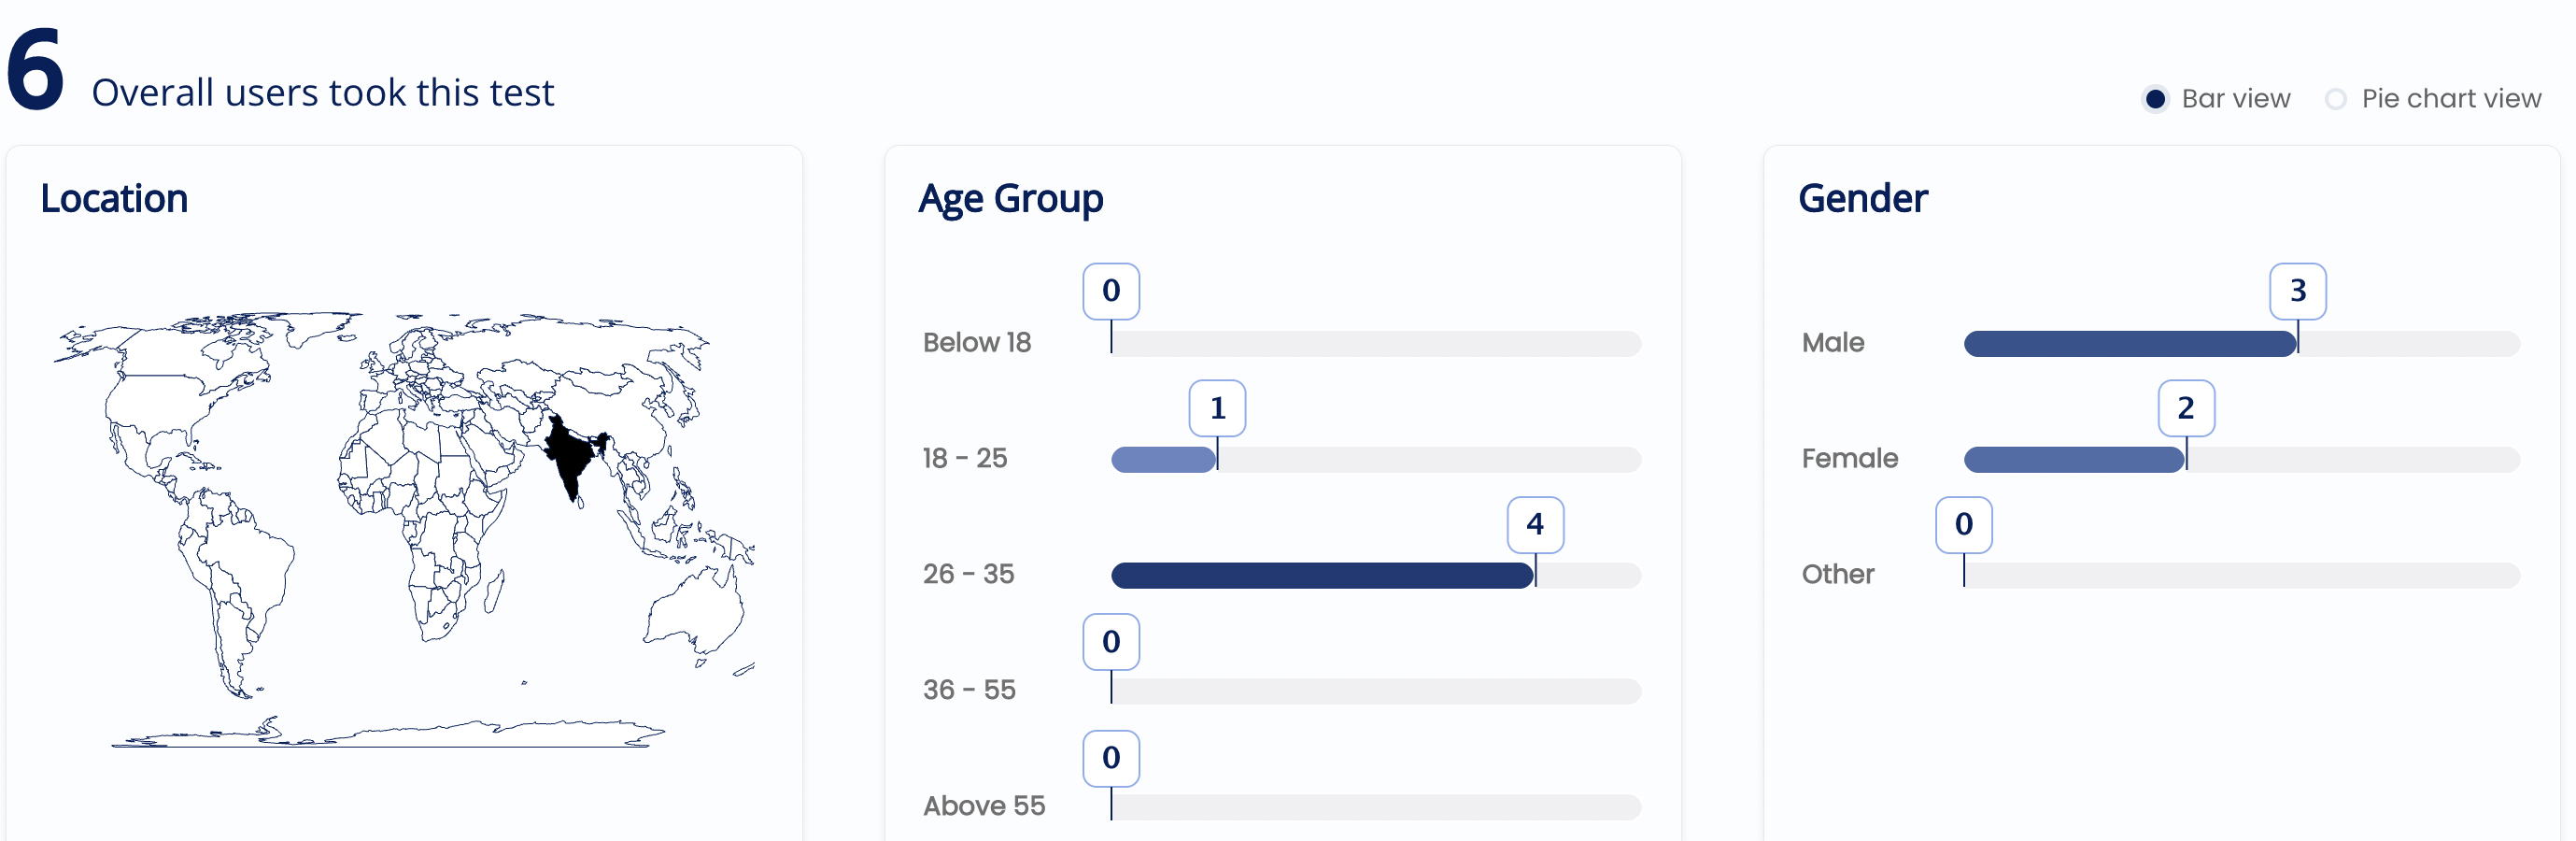
- Location - The map chart highlights the geographies of the respondents and provides a count against each geography.
- Age Group - The Age Group chart provides information on the respondents' age groups.
- Gender - The Gender chart provides insights into the number of respondents falling in the mentioned gender group.
💡The default view of the chart is shown above. However, you can change the charts to pie charts by selecting the pie chart radio button present in the top right corner of the charts.
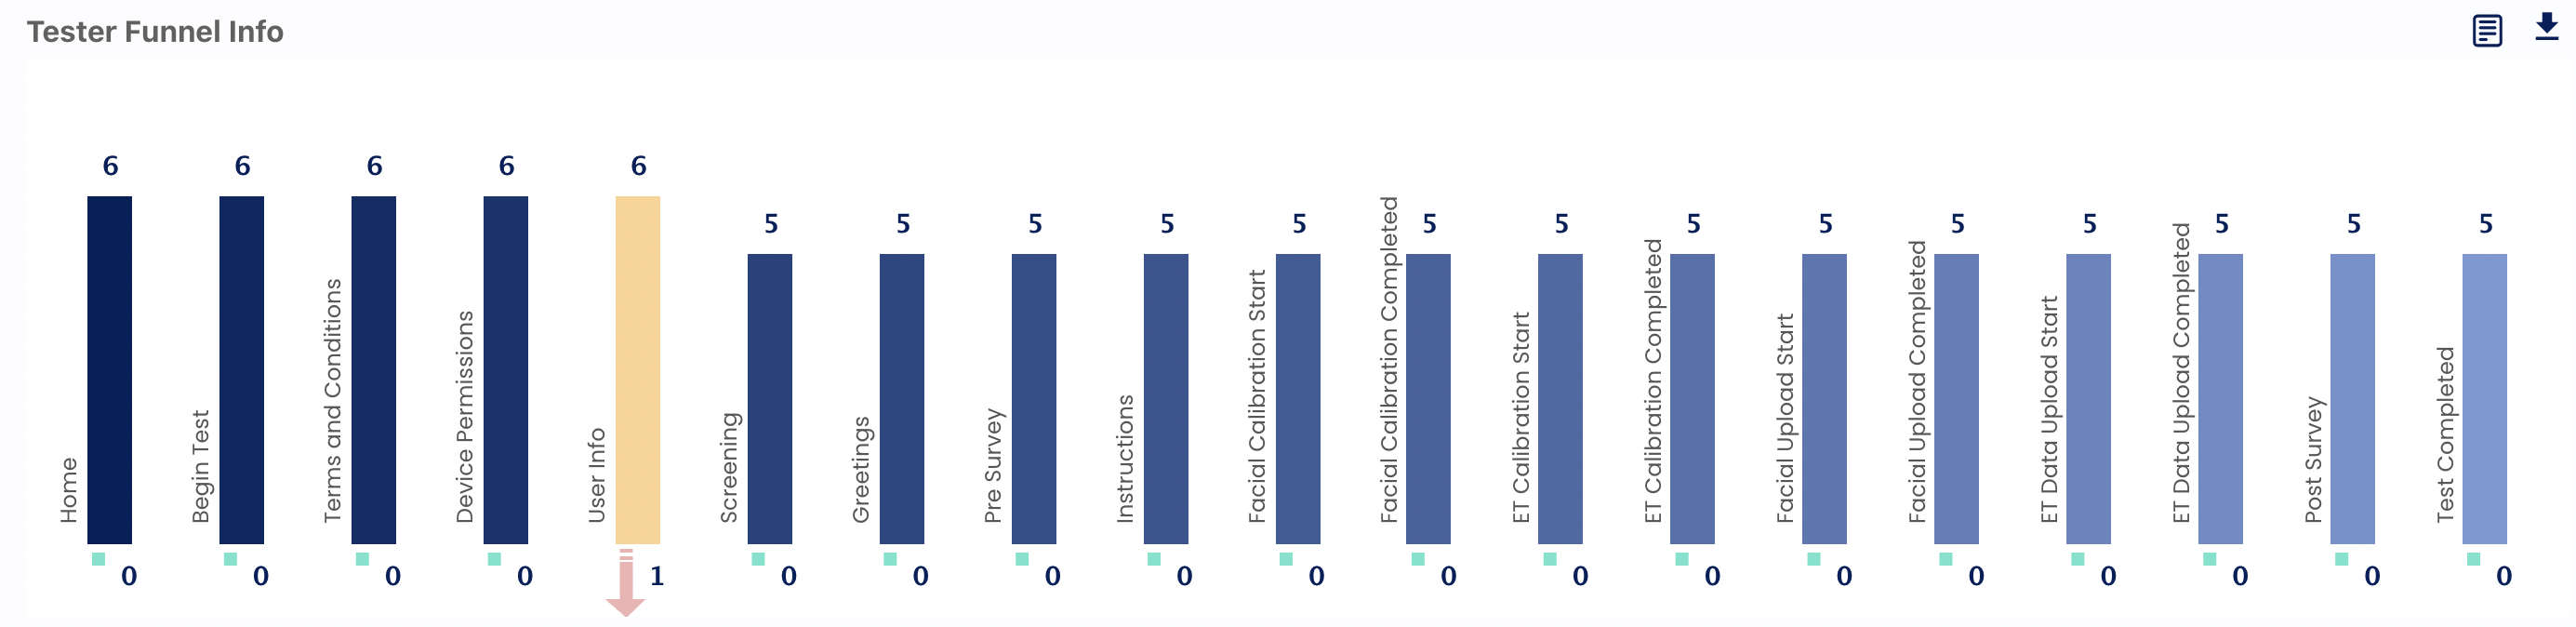
2. Tester Funnel
Tester Funnel highlights the journey testers took to complete the test and how many of them dropped off in the various sections.
The point where the respondents have dropped is highlighted with yellow, and a down arrow is added for quick understanding.
These charts provide insights into the number of stimuli completed successfully or skipped/aborted during the test by the respondents.
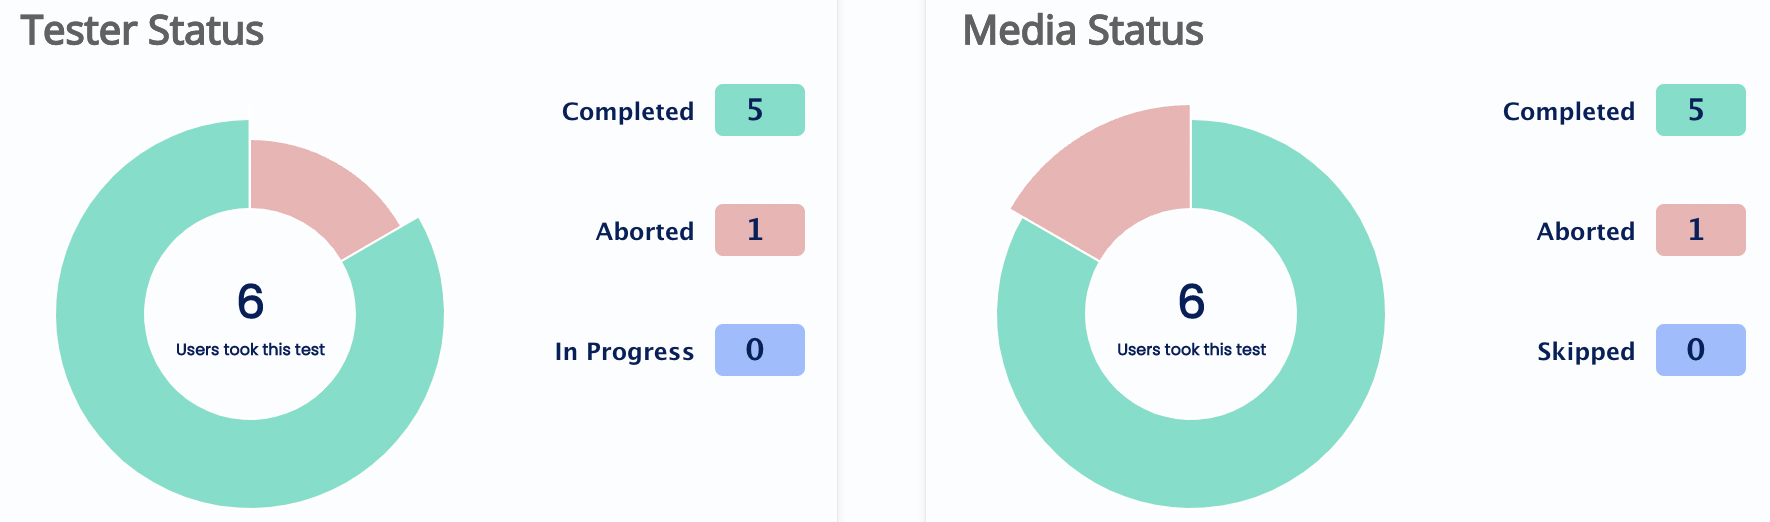
- Tester Status: This Donut chart shows the number of respondents who completed or skipped/aborted the survey.
- Media Status: This Donut chart shows the count of the media which were watched completely or were skipped/aborted.
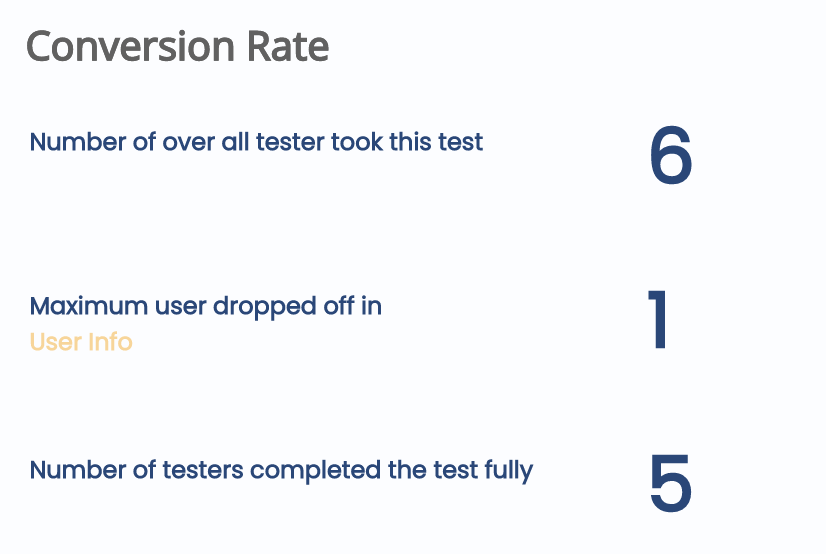
4. Conversion Rate
The conversion rate chart shows the number of respondents who took the test, the drop-off point of the maximum number of respondents and the number of respondents who completed the survey.