What is Insights Beta?
Insights Beta is the updated version of Insights previously available in Affect Labs.
The insights module covers various aspects of the campaign results using the different dashboards. Individual charts inside the dashboards provide deeper insights. Affect Lab's proprietary metrics measuring the Affective insights are available on the charts. All the charts in the insights are easy-to-understand and self-explanatory.
 Features of New Insights✨
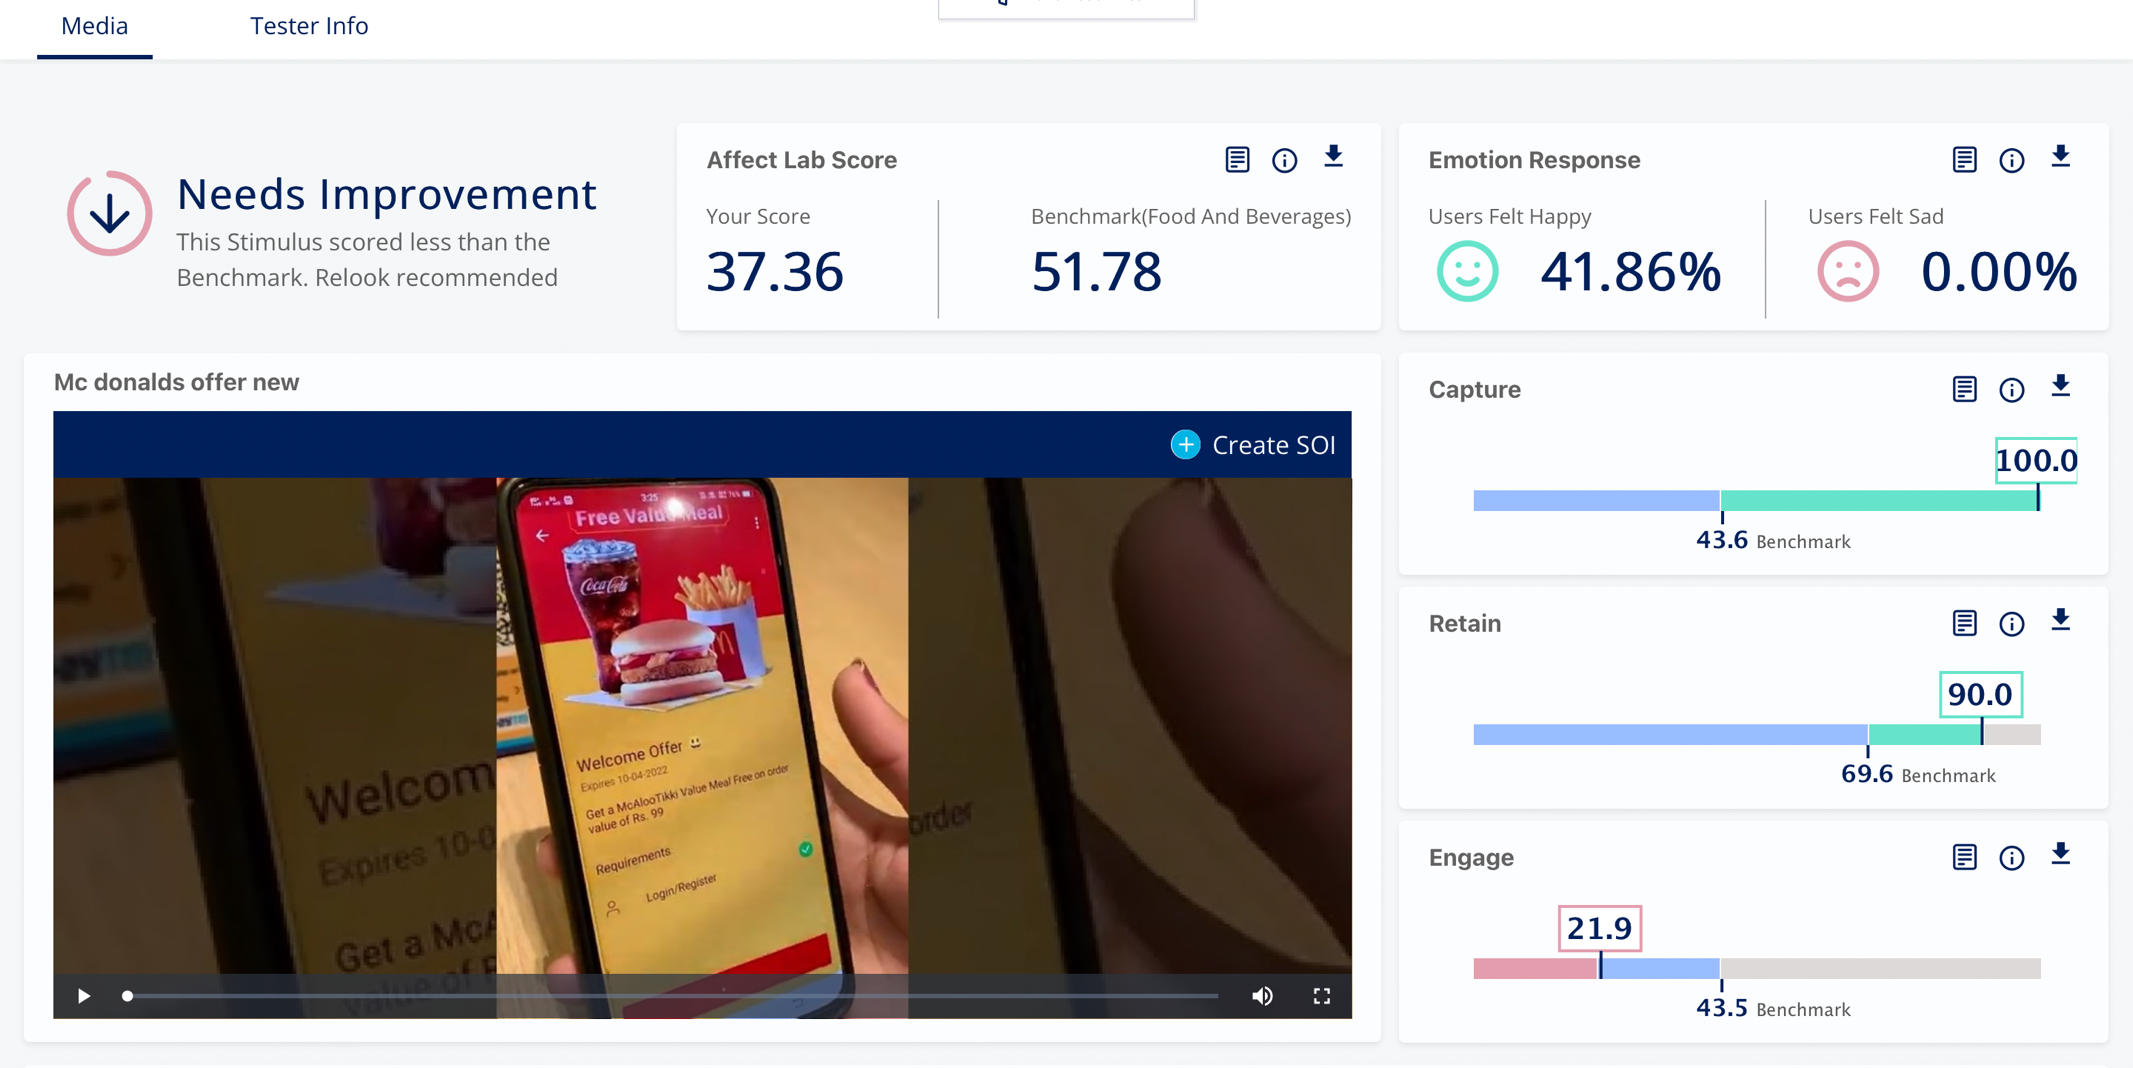
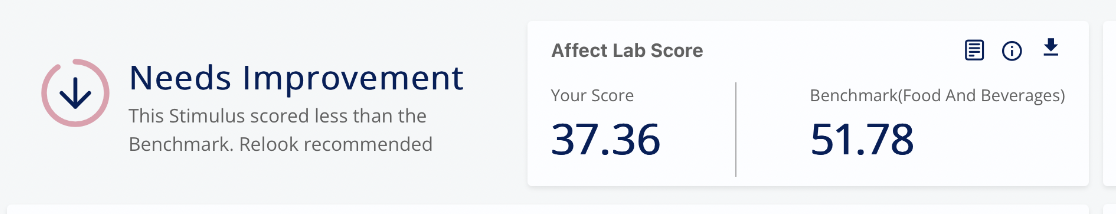
1. Media Performance: For all the media present in the Affect Lab, the overall score is compared with the scores of other media in the same category. By comparing the score, the suggestion is provided on the media performance.
2. Unified Dashboards: The new Insights comes with two unified dashboards, one for insights into the media and another for the tester insights.
- Media: In the new Media dashboard, all the charts related to media insights are available in one dashboard; this section comprises the charts like emotion responses, AOI, the performance of media, screening, pre-survey etc., which will help you understand all the insights at once without switching to different tabs.
- Tester Info: To get insights on the tester's related information, a different dashboard, "Tester Info", is present, where charts like tester status, tester funnel, demographics graph etc. are present.
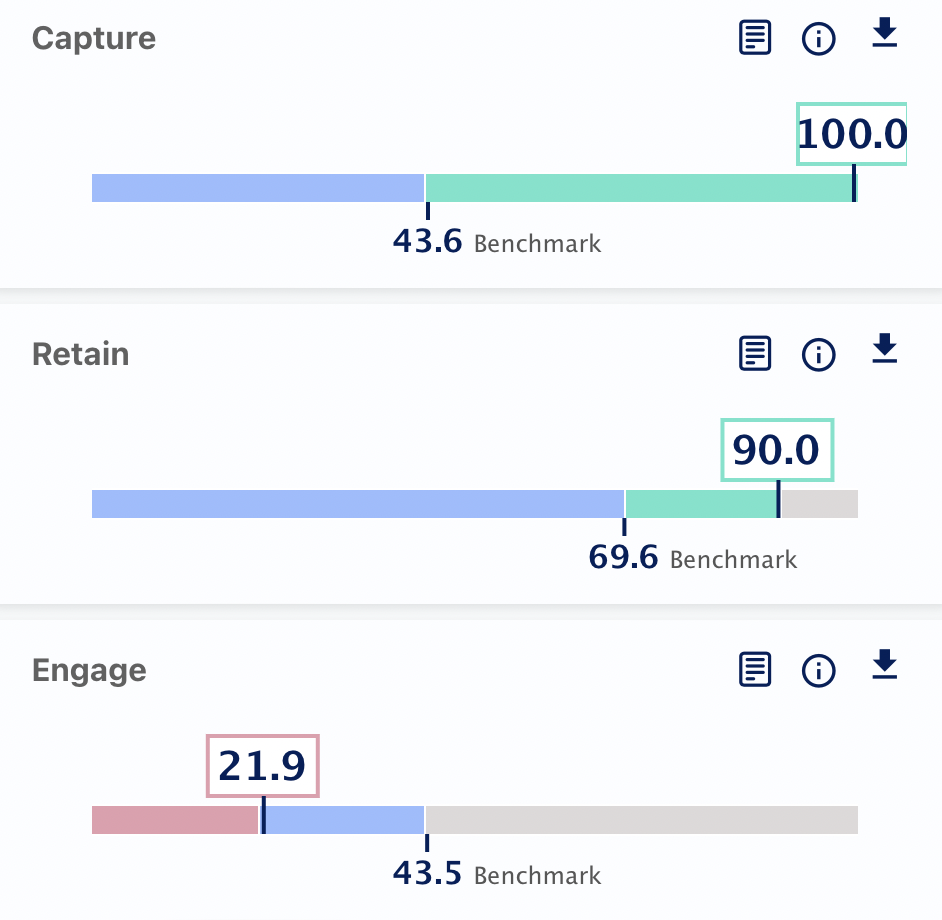
3. Benchmark score comparison: For the charts of engagement, retention, and capture, the score is compared with the benchmark scores of the media of the same category. The benchmark score is the average score of all the media of the same category; this will help you understand how your media is performing against the other media of the same category.
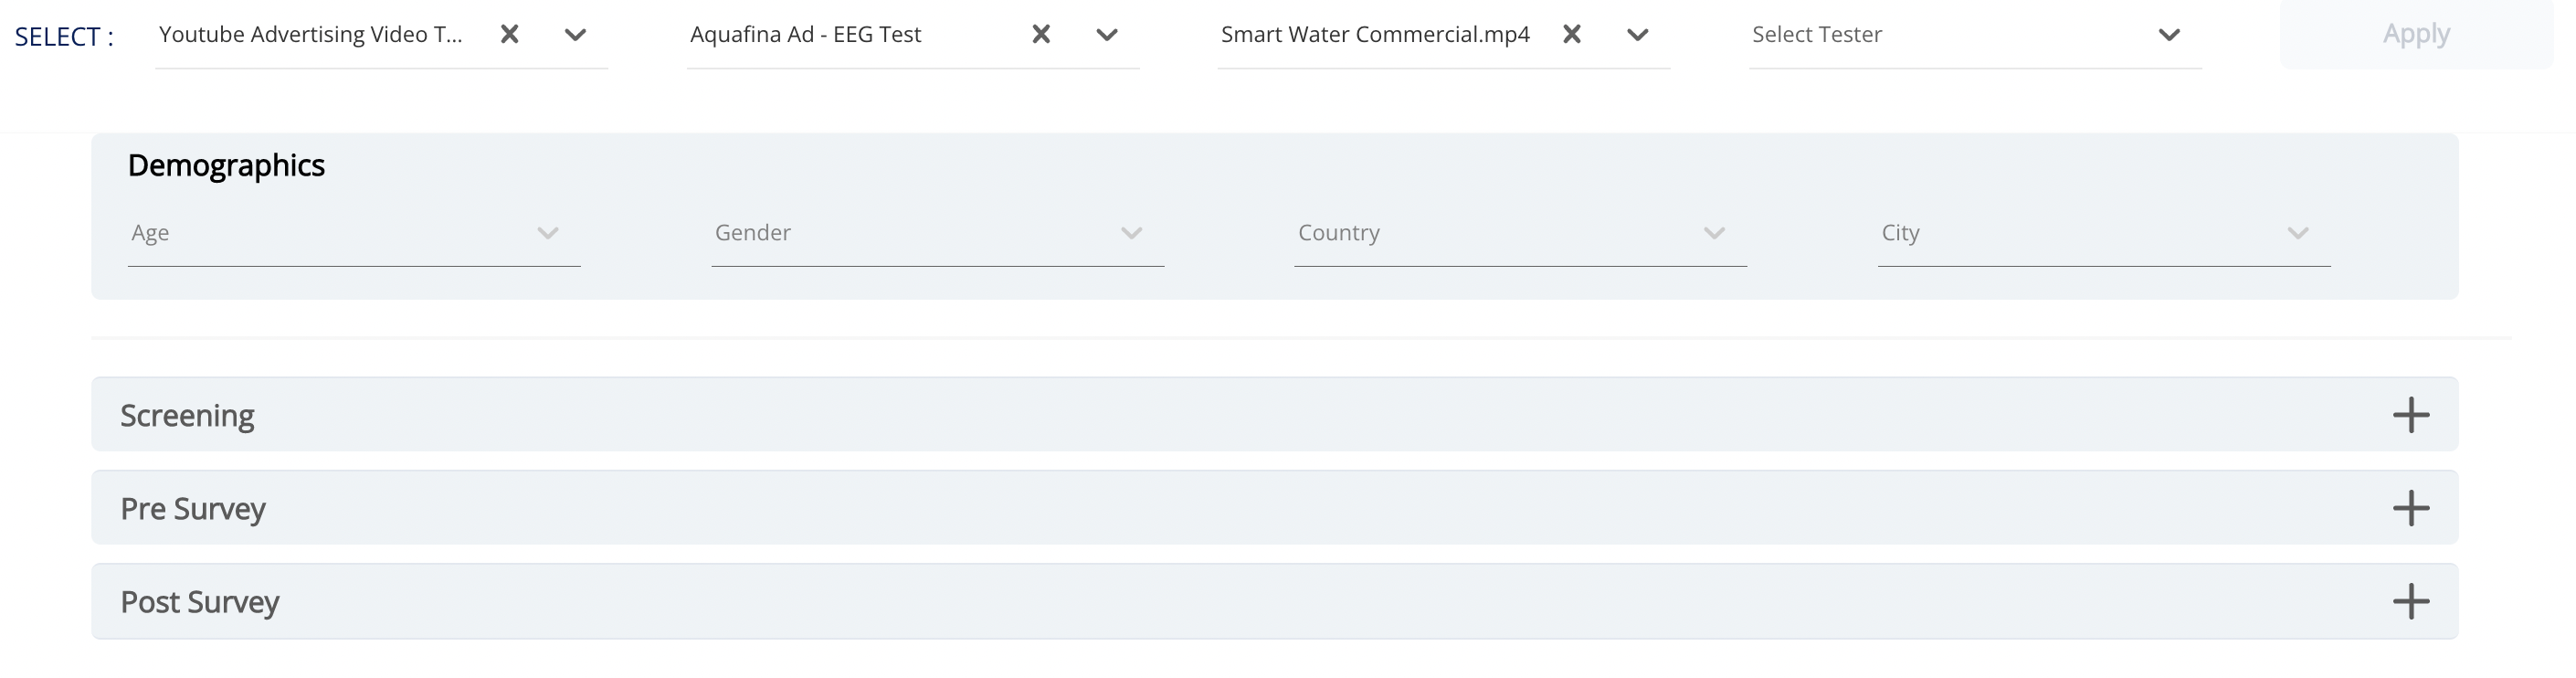
4. Advanced Filter: Using the advanced filter, you can get insights for the specifically required information. Filters can be applied to the survey stage responses, demographic data of the respondents, respondents' status etc.