Summary Insights dashboard
This article talks about the various charts and Insights available in the Summary Insights Dashboard.
Summary Insights, as the name suggests, provides an overall summary of the research campaign.
Starting with the list of stimuli and their respective AffectLab score, the dashboard covers details on participants' demographic information and completion status on the tested stimuli.
Below is a sample of how the Summary Insights Dashboard will appear. The insights shown are from an illustrative campaign, created to compare the efficacy of different types of product designs using the product pictures as stimuli.
The next section provides a snapshot of the participants' demographic insights through below charts,
Location - The map chart highlights the geographies of the participants and provides a count against each geography
Age Group - The Pie chart to the left of the map chart provides a pictorial representation of the participant's age groups
Gender - The bar chart to the right provides insights into the number of participants based on their gender
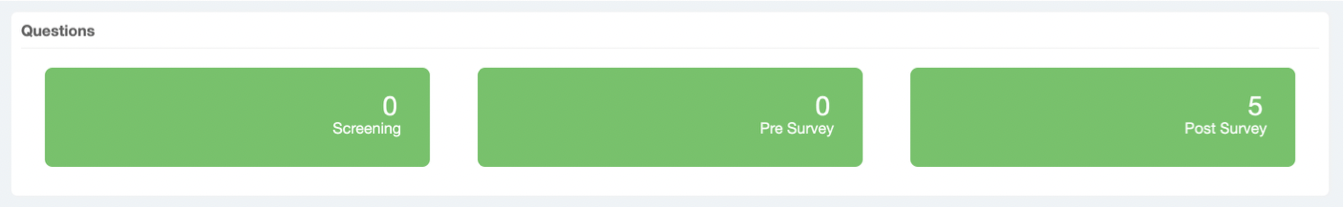
Questions - The number of questions that were part of each of the Screening, Pre-Survey, and Post-Survey sections can be found below the Respondent Information section. This section list the total number of questions that were prompted to the participants in the Screening, Pre-Survey, and Post-Survey sections.
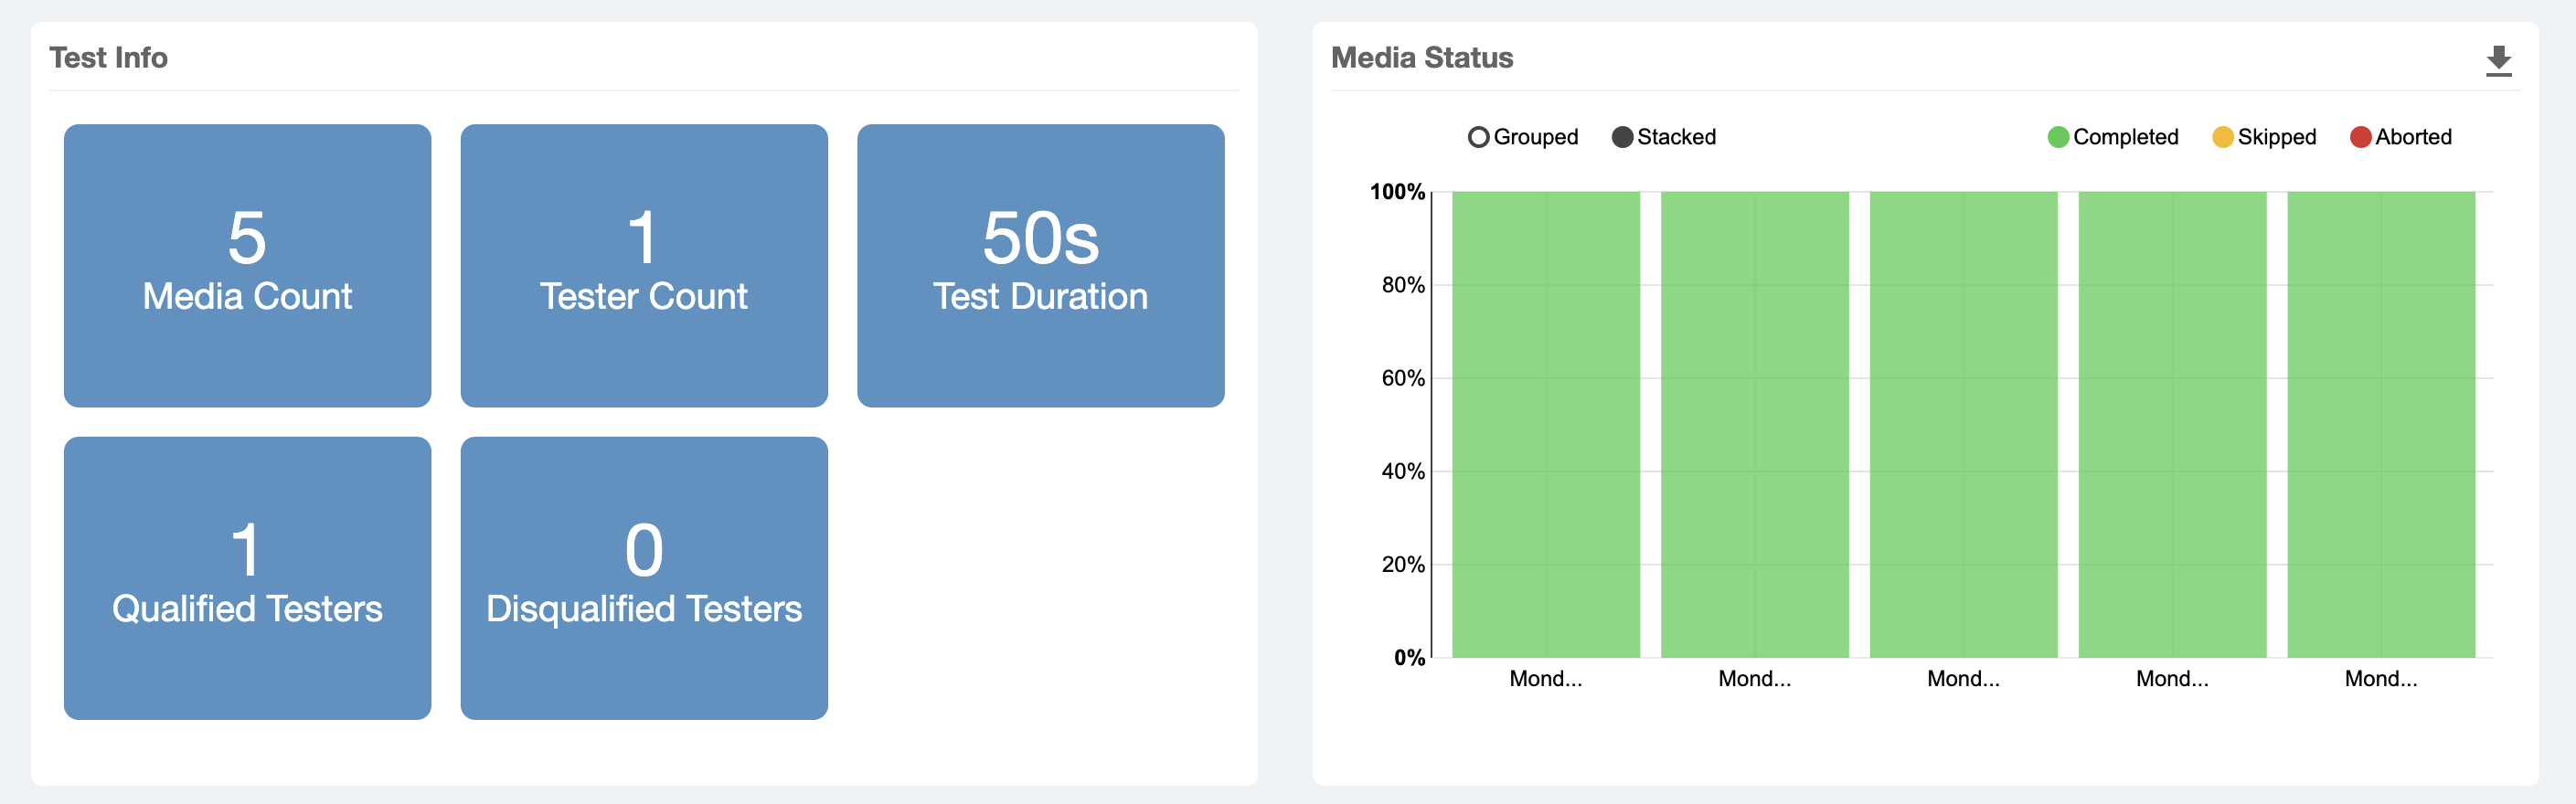
Test Info, Media Status, and Tester Status - Combined together, these charts provide insights on the number of stimuli that were completed either successfully or skipped/aborted during the test by the participants.
Tester Funnel - Highlights the journey testers took to complete the test and how many of them dropped off in the various sections.
Following the Summary Insights dashboard, Emotion Insights Dashboard provides insights into the Emotional Scores of the Stimuli at a second-by-second level. Please access the various sections of the Emotion Insights Dashboard.