
Survey Insights Dashboard
The Survey Insights Dashboard provides insights on the Survey Question responses from the campaign.
The Survey Insights dashboard is where users can view responses to the survey questions. Survey questions are a key component of any study and it helps in eliciting key insights (Recall, Satisfaction, etc.) from participants.
Survey questions are classified into three sections: Screening, Pre-Survey, and Post-Survey. Users can select any questions to view the response as a real-time chart in the dashboard.
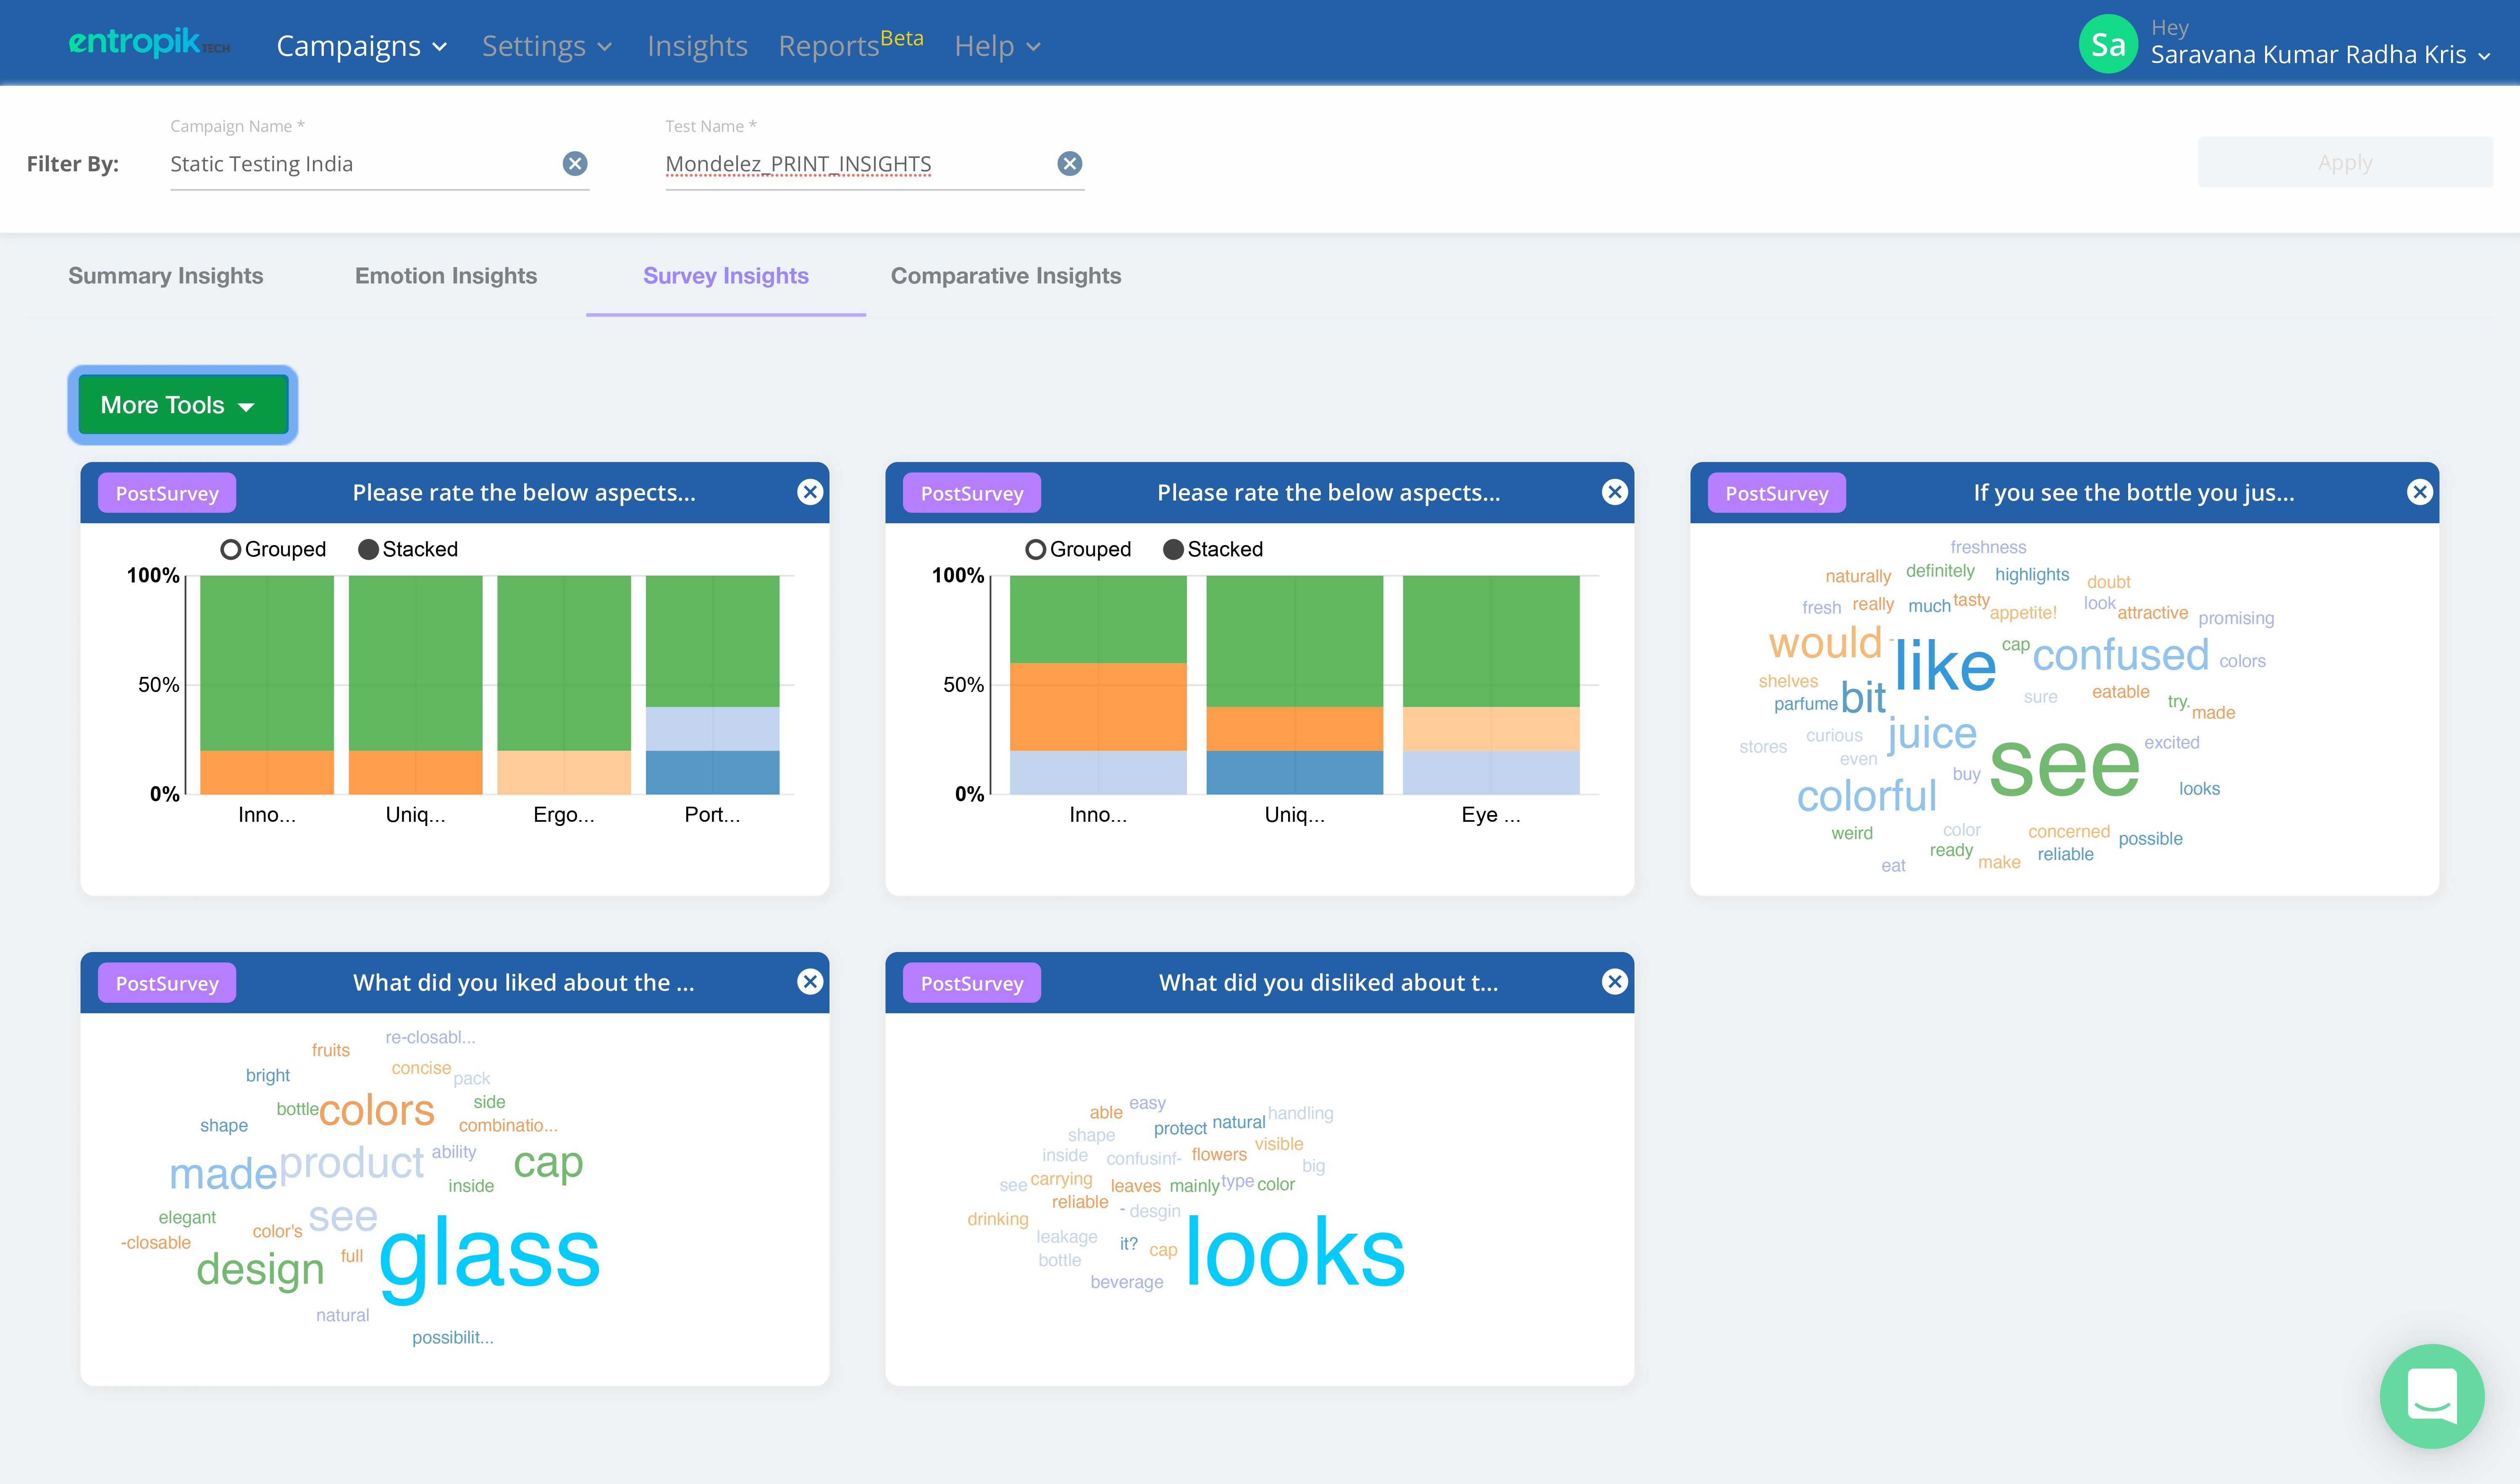
Below is an illustrative Survey Insights Dashboard.
Users can click on the "More Tools" option available at the top left of the Dashboard to select a question.
How to select questions in the Insights Dashboard
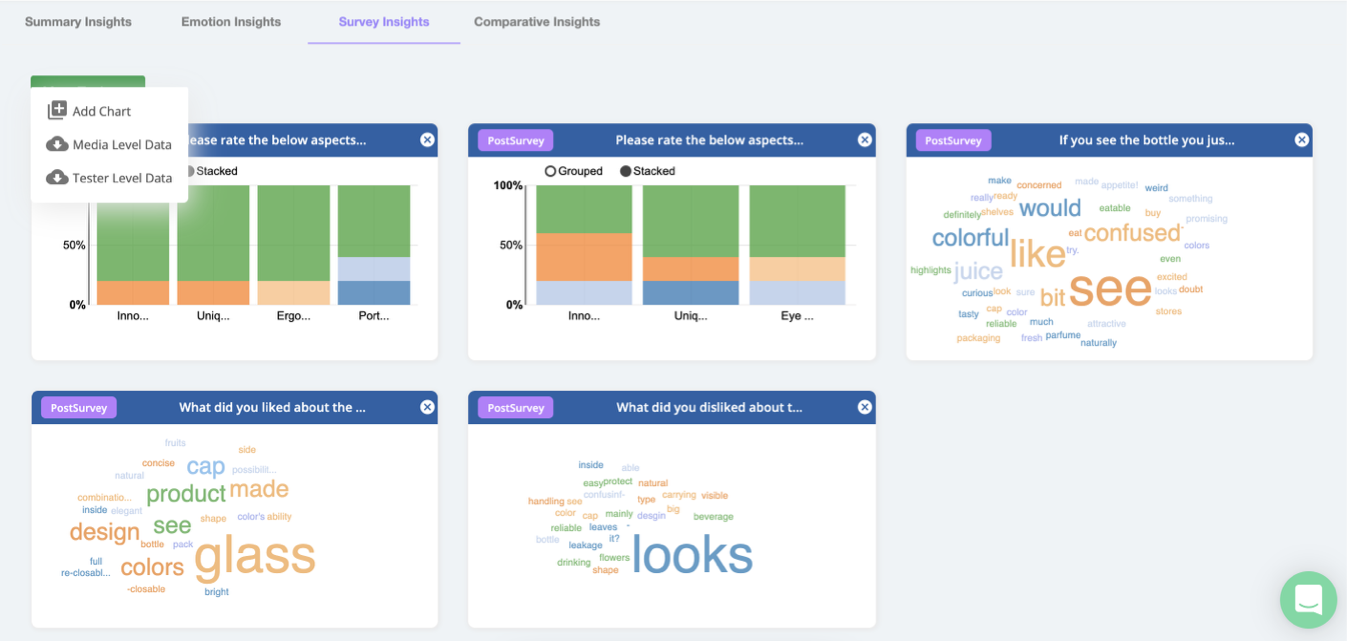
Step 1: Click on More Tools. Users can see a dropdown list with the below options,
Add Chart
Media Level Data Tester Level Data
Step 2: Select "Add Chart" from the dropdown. Add Chart window appears as shown below.
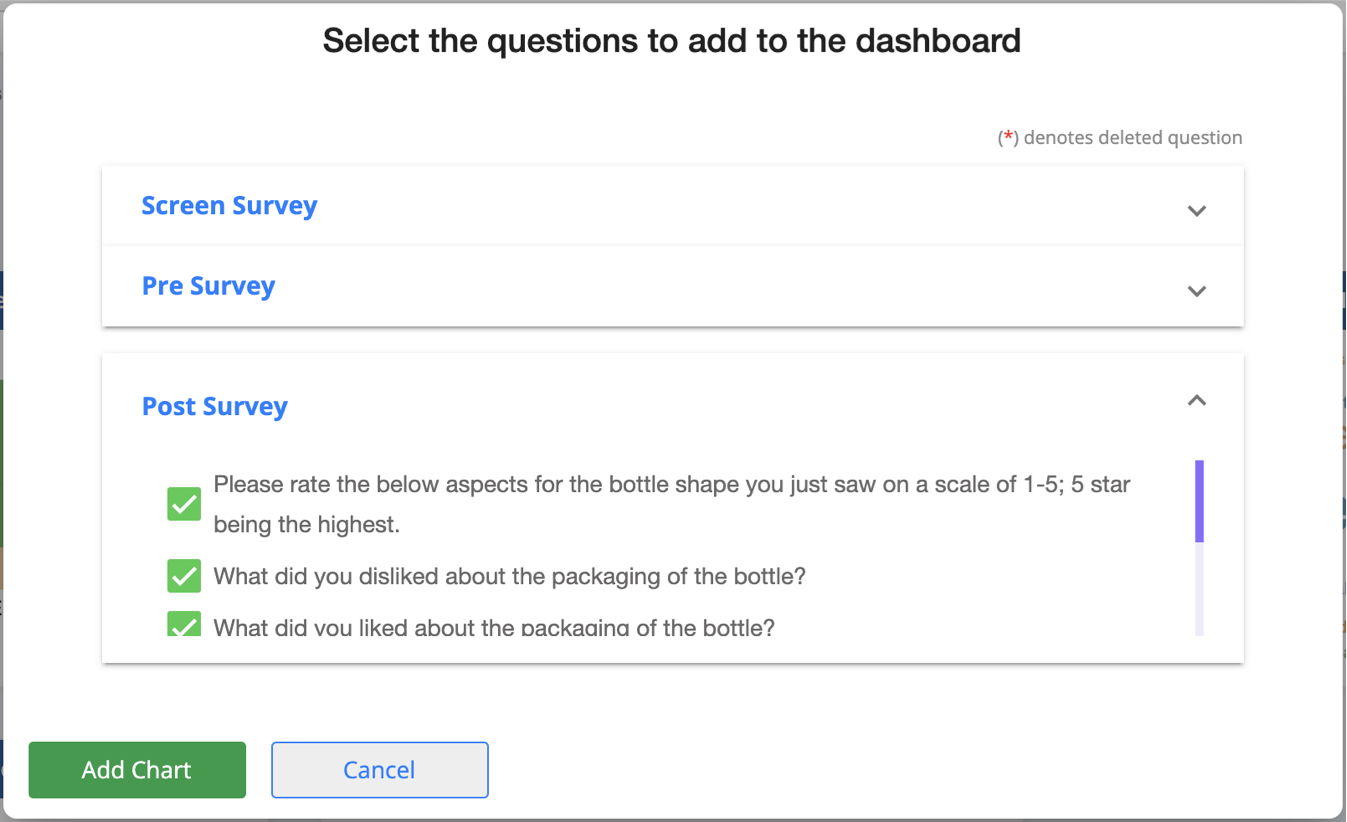
Step 3: Select the required list of questions. Users can select any question from the Screening, Pre-Survey, and Post-Survey sections.
Step 4: Select "Add Chart".
Charts for the selected questions are generated and made available to users in the Dashboard.
Users can also download survey responses as CSV files for further analysis. Click on More Tools and select Media Level Data or Tester Level Data to download the survey responses as editable CSV files.