Once you have launched your shopper insights campaign, you will find the insights based on the technology selected while creating the test. You will find the insights segmented into three dashboards:
Deep Dive
Comparative Insights
Tester Info
In this article, we will guide you on different metrics available in the Deep Dive Dashboard.
Deep Dive Dashboard
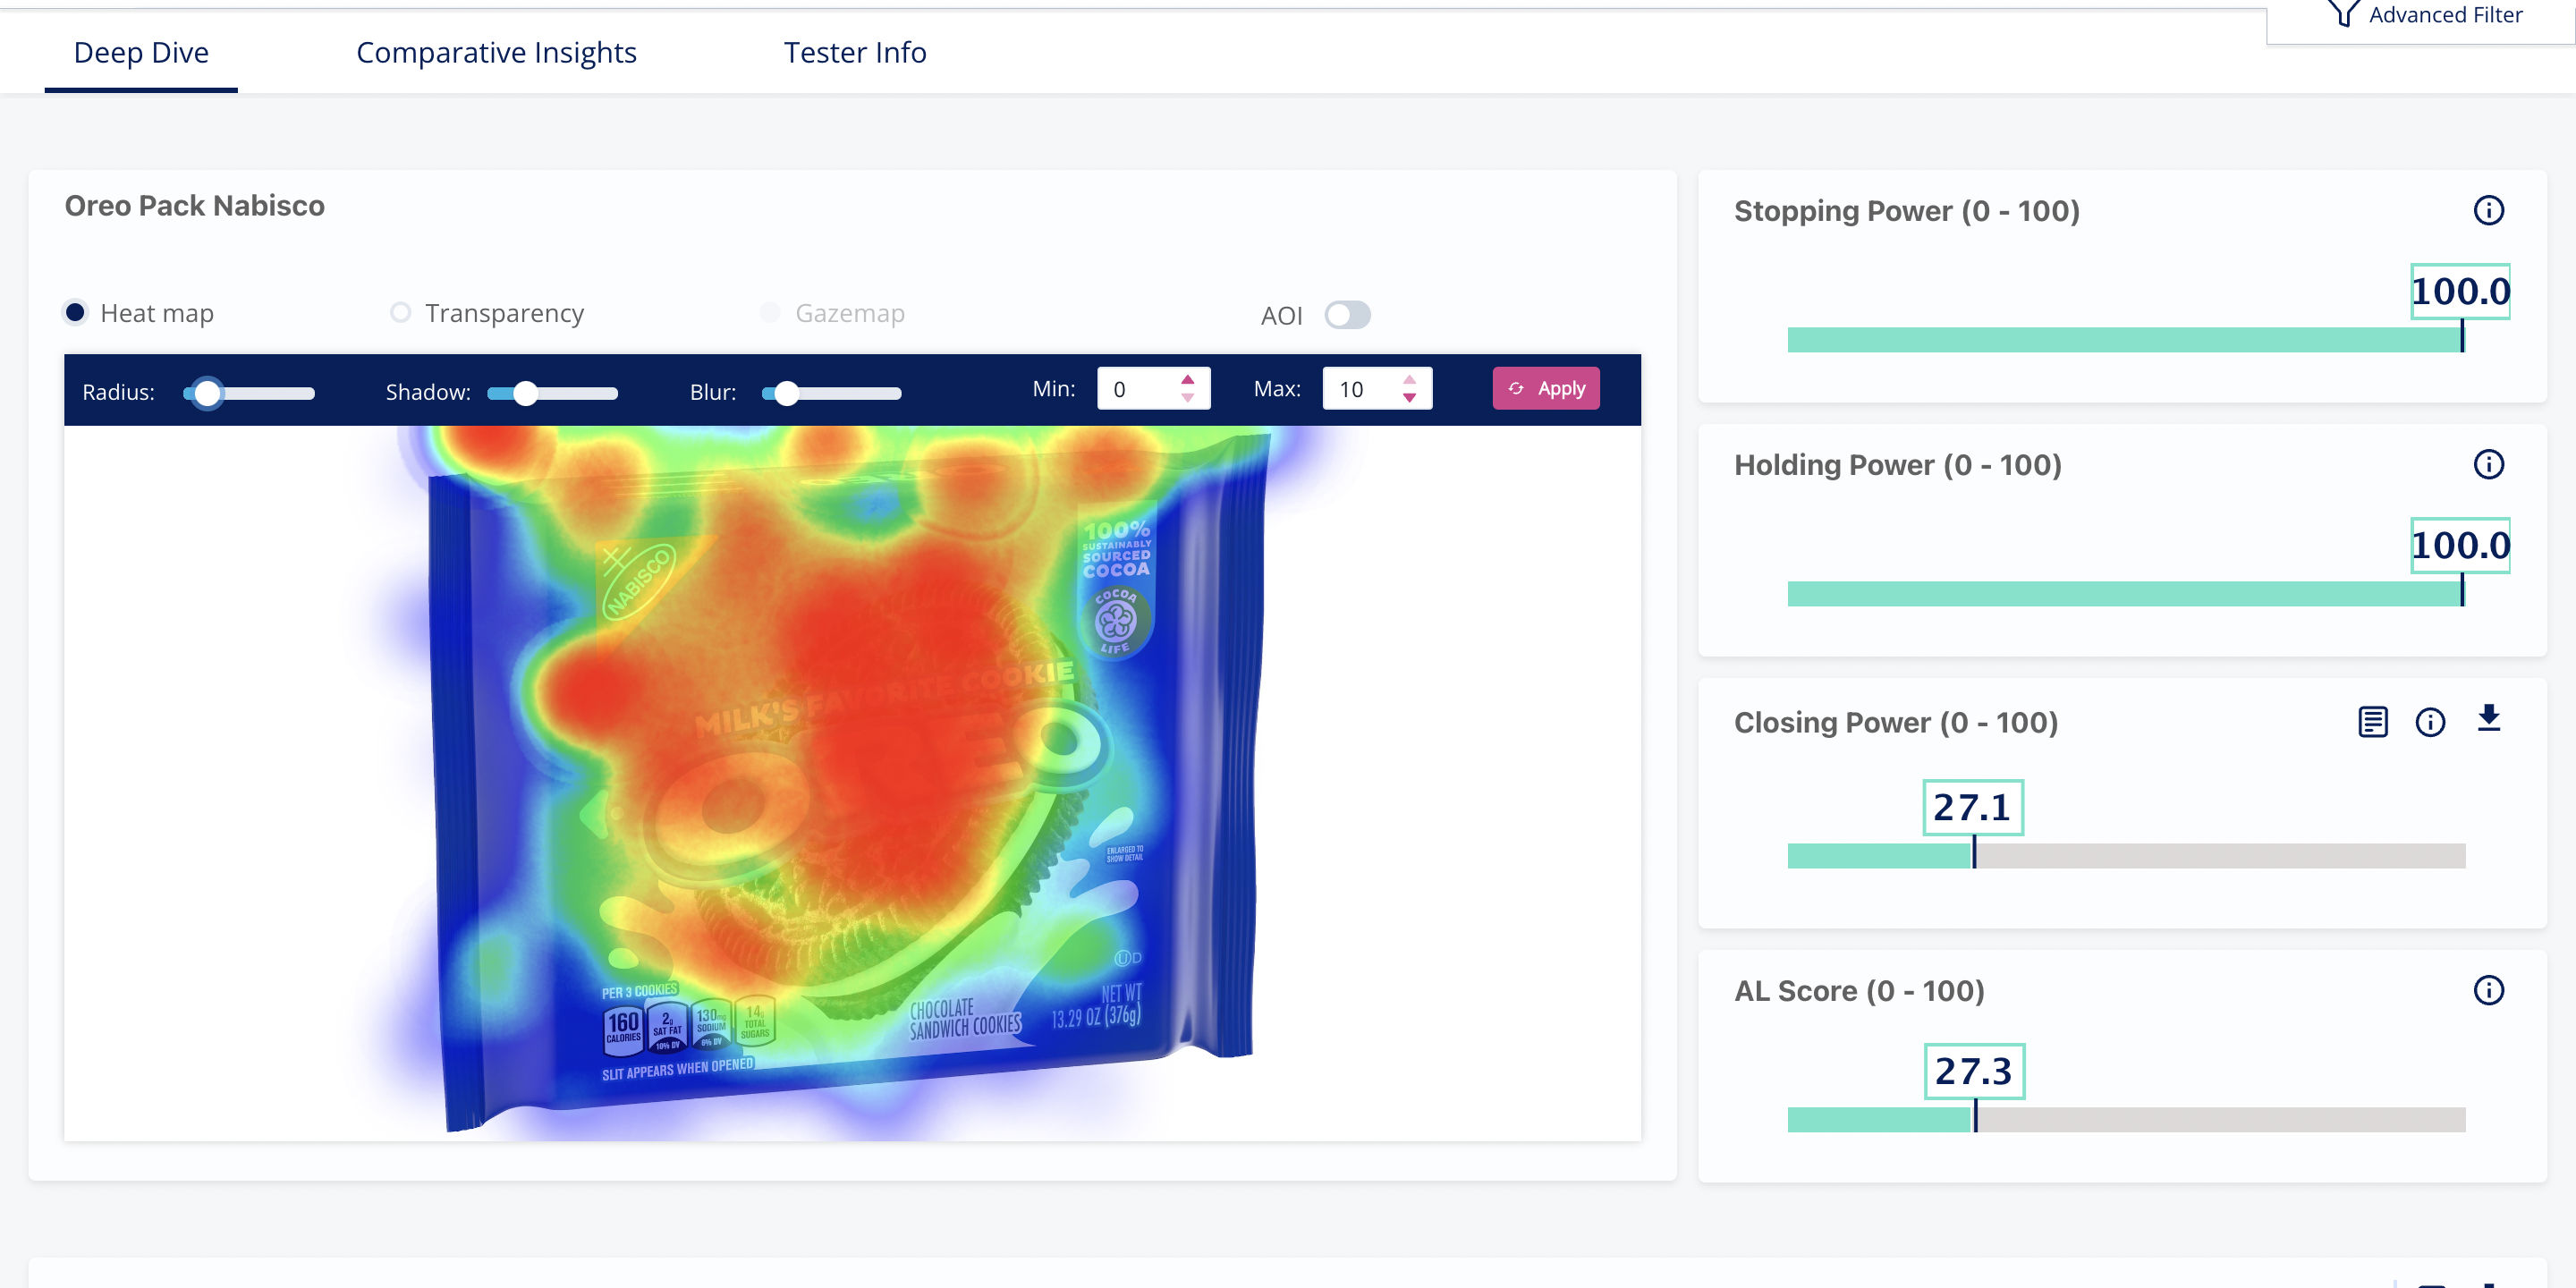
This dashboard provides a detailed analysis of the data collected from your campaign. It includes metrics from facial coding data and eye tracking data such as heatmaps, transparency maps, stopping power, holding power, and closing power.
In this dashboard, you will find the stimuli added to the test, along with the heatmap and the transparency map.
Heatmap:A heatmap is a visual representation of areas that were viewed most by the respondents. It uses a VIBGYOR gradient to change colour and intensity, with brighter colours highlighting areas that were viewed more often by the respondents. This can be used to identify the most viewed areas of the stimuli.
Transparency map: Just like Heat maps, Transparency maps are also plotted using the participant's Gaze Points on top of the Stimulus. But instead of using varying colour intensities, the Stimulus is made transparent where the gaze points aggregate.
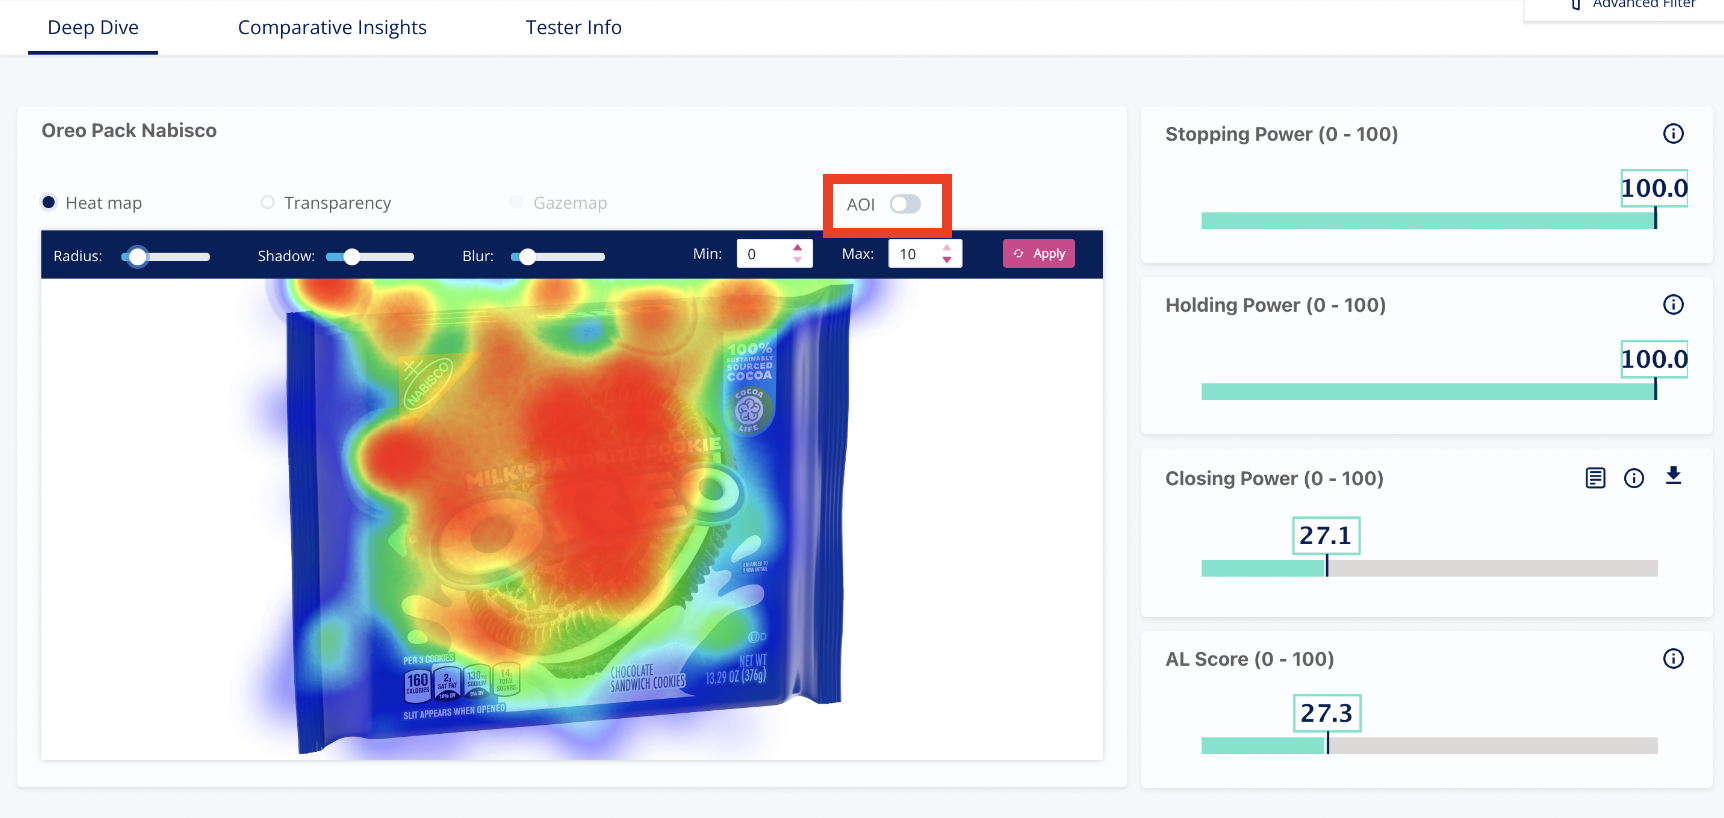
Area of interest: You can also create AOIs in the stimuli. Area of Interest (AOI) functionality allows users to define specific areas within their stimuli that need to be measured for their noticeability, earned attention, etc. Examples of such areas of interest can be a brand logo on a pack, pack clusters on a shelf, or a character in a video.
Shopper Insights Metrics
1. Stopping Power: Captivating the Shopper's Attention
Stopping power is the ability of a packaging design to attract the attention of a shopper from a distance. It is a measure of how likely a shopper is to stop and look at a particular package on a shelf. Stopping power is important because it is the first step in the buying process. If a package does not have stopping power, it is unlikely that the shopper will even see it.
The score for stopping power is also normalized on a scale of 0-100, providing a comprehensible basis for comparison, and it is calculated for the whole stimuli.
2. Holding Power: Attention Earned
Holding power is the ability of a packaging design to keep a shopper's attention after they have stopped to look at it. It is a measure of how likely a shopper is to continue reading the package and learning more about the product. Holding power is important because it helps to ensure that the shopper has a positive impression of the product and is more likely to buy it.
The score for holding power is also normalized on a scale of 0-100, providing a comprehensible basis for comparison, and it is calculated for the whole stimuli.
Closing Power is a measure of the emotional intensity evoked by a packaging design while watching it. It is correlated with persuasion, meaning that packages with high closing power are more likely to persuade shoppers to buy the product.
Closing power is measured on a scale of 0 to 100, with 100 being the highest score. The score is calculated by taking into account the following factors:
4. AffectLab Score(AL Score): Overall Score
It is an overall score between 0 - 100 that sums in weights of facial coding and Eye tracking with reference to the category benchmark to assess the overall efficiency score for a given stimulus.
Area of Interest (AOI)
Note: Only after enabling the AOI toggle button will this section appear.
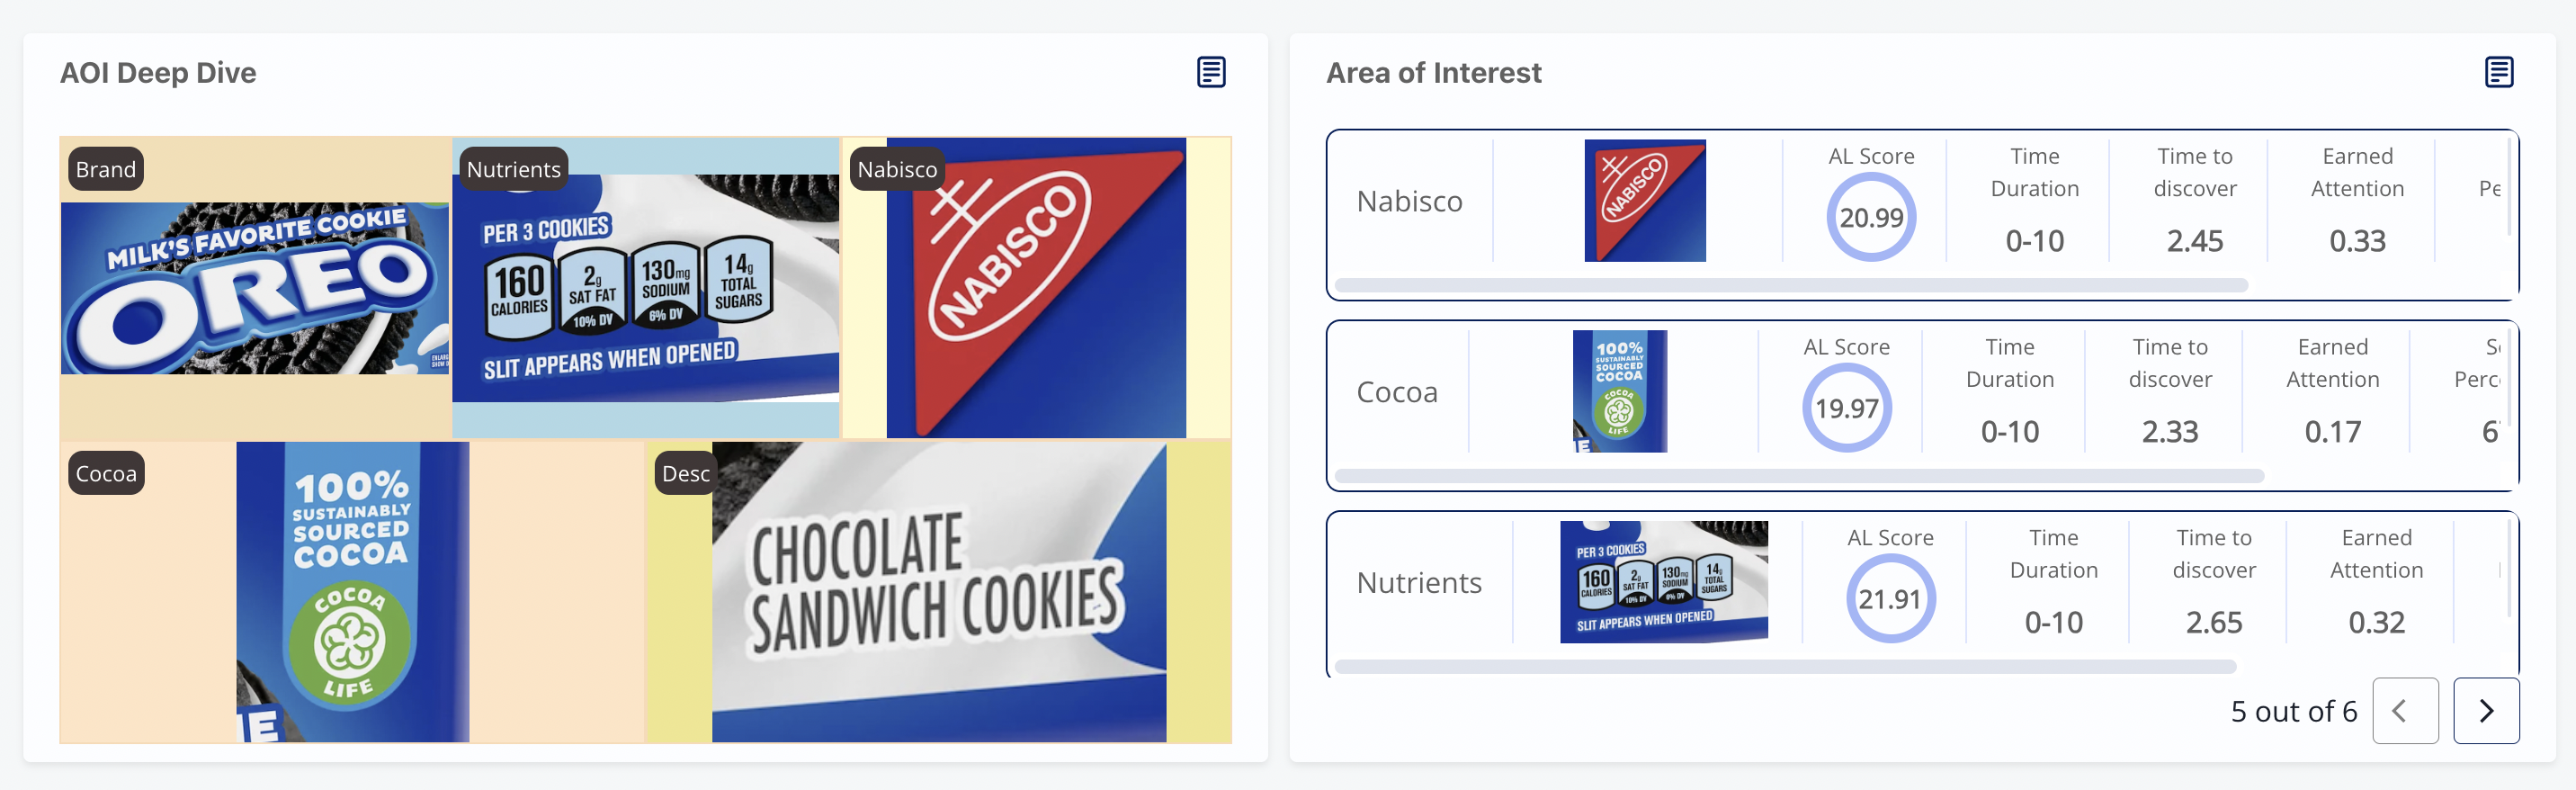
If you have created any AOIs in the stimuli, you will find the detailed metrics for all the AOIs, and the top five performing AOIs will be shown in the "AOI Deep Dive" section.
Exposure time duration: This is the Time taken by the users to spend on a particular position of the product on a planogram and calculated as the total Time spent on a specific AOI.
Average Time to First Discovery: Time taken by a user to figure out their first "Area of Interest" across all the testers meant to measure the noticeability. The Lower, the better.
Seen percentage: The percentage of people who saw the stimulus and also saw the AOI.
Percentage People watched: Calculated by the number of people who looked at the AOI vs. the total number of testers meant to measure the pack relevance with respondents.
Earned Attention/Held Attention: Number of seconds of continuous view held by the AOI meant to measure efficacy.
Affect lab score: An overall score between 0 and 100 that summarizes the results of eye tracking and facial coding metrics. The score is calculated by weighting the different metrics according to their importance and then averaging the results. The affect lab score can be used to assess the overall effectiveness of a creative.
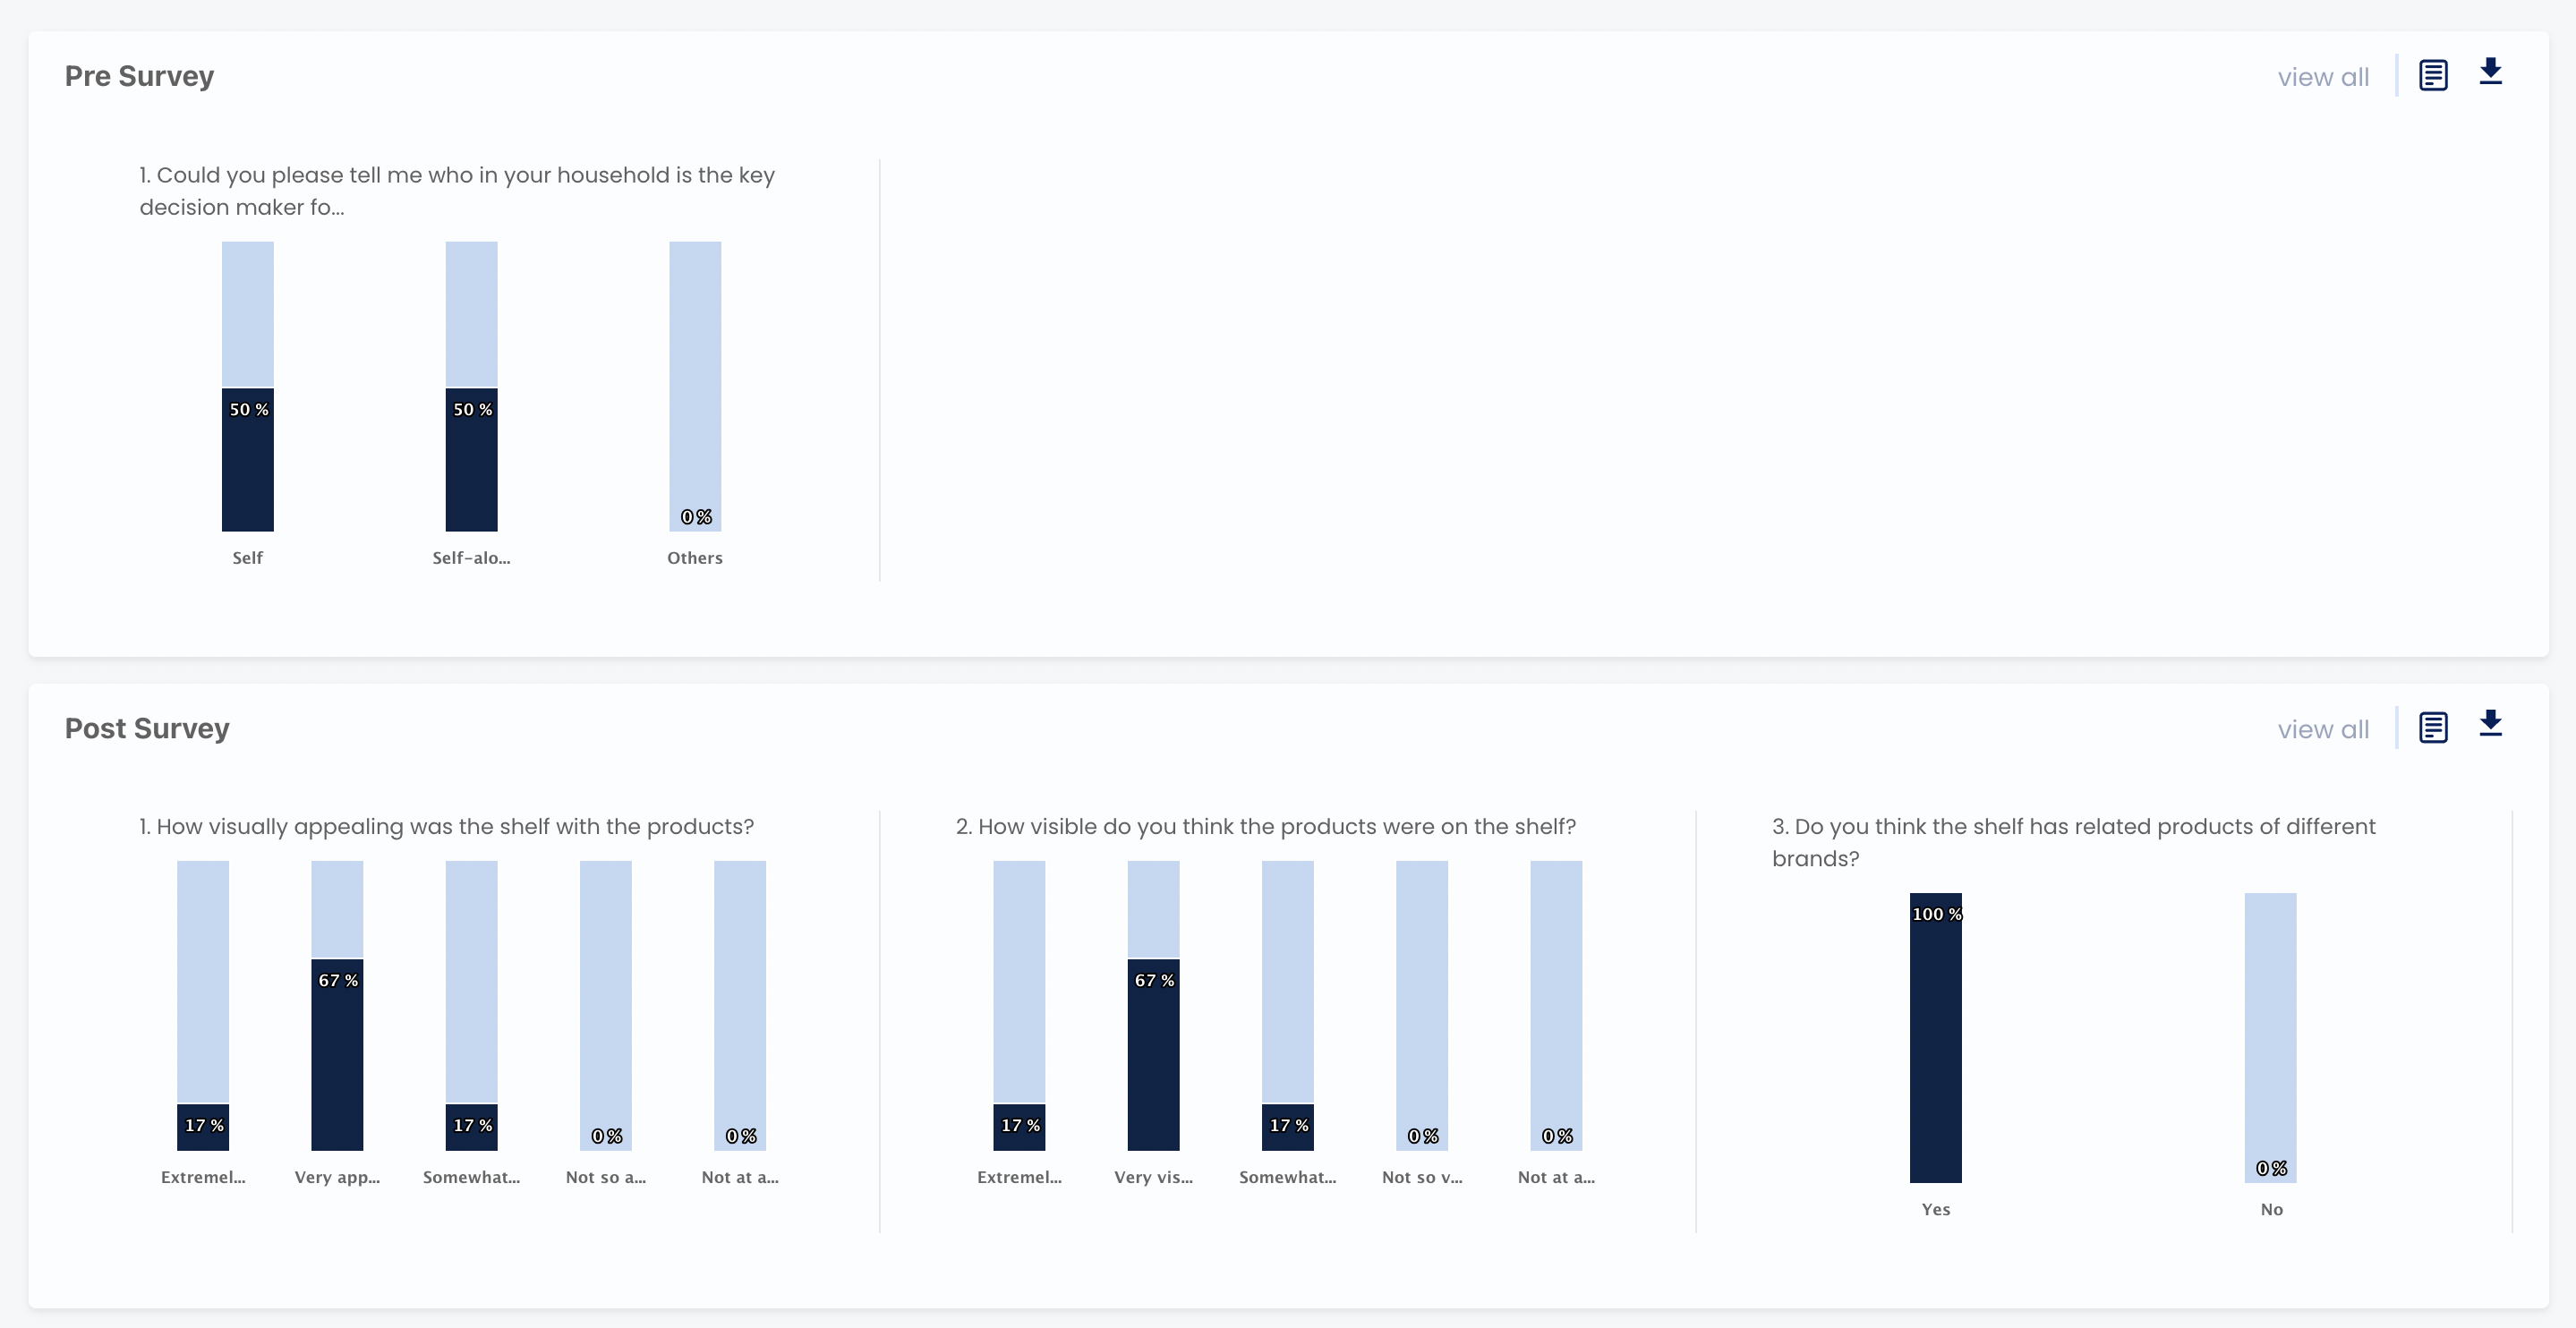
Survey Questionnaire
Below the metrics, you will the pre-survey and the post-survey questions results in the form of column charts. You can download the data in CSV format.
You can also download the data in CSV format for further analysis. Additionally, you can add notes to the data, which can be viewed by other users of the platform. This can be helpful for providing context or insights into the data.